Download
1 / 15
150 likes | 158 Views
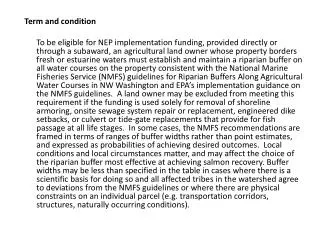
Sight Distance and Roadway Condition. Dan Walsh, P.E. Summary. Sight distance and variable speed limit signs Roadway conditions Wet Weather Accident Reduction Program. Interstate 35. I-35 constructed in 1955 No change in vertical profile 60 mph design speed

E N D
Sight Distance and Roadway Condition Dan Walsh, P.E.
Summary • Sight distance and variable speed limit signs • Roadway conditions • Wet Weather Accident Reduction Program
Interstate 35 • I-35 constructed in 1955 • No change in vertical profile • 60 mph design speed • Design speed is maximum safe speed • 70 mph posted speed limit • 74 mph 85th percentile speed
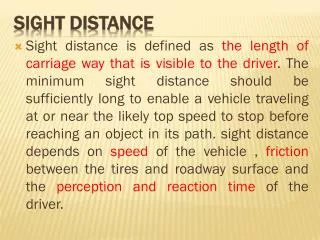
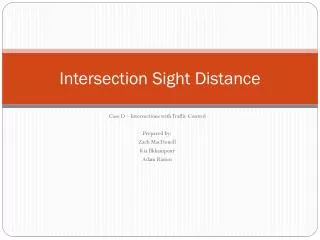
Sight Distance • Roadway ahead visible to driver • Long enough to allow a vehicle traveling at design speed to stop
Available sight distance 767 feet
Stopping Sight Distance • Distance traversed from object detection to stop • Should be less than available sight distance • 900 feet at 60 mph • 1,293 feet at 70 mph • Exceeds available sight distance of 732 to 767 feet
Variable Speed Limit Signs • Alert drivers to reduce speeds in hazardous conditions • Increase safety • Washington (Snoqualmie Pass) • New Jersey Turnpike • More cost-effective than reconstruction
Macrotexture Pavement Depth • Affects water drainage • No national standards • TxDOT research recommended 0.035 inch • Accident site • 0.017 to 0.018 inch in right lane • 0.024 to 0.027 inch in left lane
Rut Depth • Water accumulation • TxDOT recommends resurfacing when ruts greater than 0.5 inch • Shallow rut depth problem • Right wheel path: 0.25 to 0.35 inch • Left wheel path: 0.40 to 0.42 inch • Differing rut depths can lead to rotational forces on vehicle
Roadway Friction • FHWA does not specify minimum • Texas Pavement Management Information System • Accident site coefficient of friction 0.12 in 2000 • Half of interstates in Texas have coefficients of friction 0.26 or below • Coefficients of friction on ice range from 0.12 to 0.25
Texas Wet Weather Accident Reduction Program • Identify locations overrepresented in wet weather accidents • 5 accidents within 1/10 mile segment • Short distance for interstate highways
Texas Wet Weather Accident Reduction Program • Weighted toward identifying locations in high population areas • I-35 accident location • 16 percent of accidents in wet weather • 2.35 percent wet weather exposure • Poor geometry, rutting, low macrotexture, and low friction
Wet Weather Accident Reduction Program • Limited guidance from FHWA • Each State has its own method • Illinois DOT relies on friction