Download
1 / 29
290 likes | 399 Views
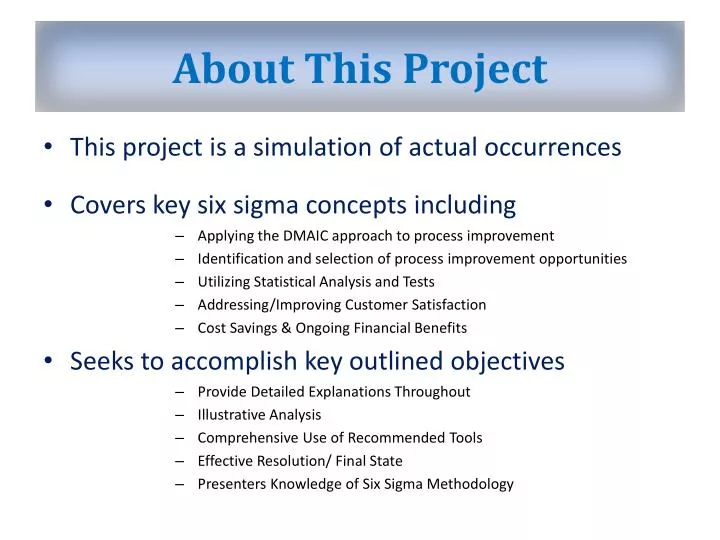
About This P roject. This project is a simulation of actual occurrences C overs key six sigma concepts including S eeks to accomplish key outlined objectives. Applying the DMAIC approach to process improvement Identification and selection of process improvement opportunities

E N D
About This Project • This project is a simulation of actual occurrences • Covers key six sigma concepts including • Seeks to accomplish key outlined objectives • Applying the DMAIC approach to process improvement • Identification and selection of process improvement opportunities • Utilizing Statistical Analysis and Tests • Addressing/Improving Customer Satisfaction • Cost Savings & Ongoing Financial Benefits • Provide Detailed Explanations Throughout • Illustrative Analysis • Comprehensive Use of Recommended Tools • Effective Resolution/ Final State • Presenters Knowledge of Six Sigma Methodology
INSTALLATION Department DSL Eastern Division Ghost Installation Reduction Project Prepared By: Joe Banks & CecilynCayetano
Definition: Ghost Installation (GI’s): Installation attempt in which the installer found no one available on-site once he/she arrived to perform an installation; resulting in a defective installation job.
DMAIC Project Description Problem: During a review of year over year comparisons of DSL-East installation reports it was discovered that the GI rate across the DSL-Eastern Division’s territory is trending an all time high of 15%, causing repeat installs and lost customers. In conjunction with the rise in GI’s there has also been a 10% increase in customer complaints due to the missed installation appointments. Scope: Metrics (unit of measure): The rate of successfully completed Installations, non-defective. Defect Definition: Installation attempt in which the installer found no one to be available on-site once he/she arrived to perform an installation resulting in a defective installation job. Objective: To reduce the rate of GI’s (Big Y) below the upper specification limit of 10%, which will in turn increase the rate of completed jobs back to normal levels of 90% or more. It is our goal to reduce the rate of Ghost Installations from 15% of total installs to below 10%, a 33% reduction resulting in DPMO < 100,000 and a yield of 90%. • Measurements: • Completed installations >90% (5% improvement). • Installations achieve a long term process sigma of > 2.7. • Eliminate the 10% increase in customer complaints. • Achieve cost savings of $99,700 within 12 months.
DMAIC DSL-East Total Install Process Key Point: Our Project’s Focus will be in the DSL Installation Department Project Selection: Several departments within the unit have improvement areas and possible projects. We selected this project by using a Project Prioritization Matrix. Prioritization Scores: scores are weighted Our Focus * RLD = Regional Logistics Department
DMAIC Key Point: The DSL East’s GI’s are Higher than Normal DSL-East’s GI Defectsvs. Other Unit Project Validation: From the historical data we can see that the amount of DSL-East GI’s is at an all time high. The DSL-West Division is performing normally. Scale zoomed in for impact. • 8% Historical Baseline Scale zoomed in for impact. Our Focus • 6.5% Historical Baseline
DMAIC Key Point: Geographical Expansion Has Expanded Service Areas for Cities Serviced by DSL-East Units Recent Changes for DSL-East Specifically Fact: Eastern U.S. Cities Experience Explosive Population Growth During the Recent Housing Boom: With the recent housing expansion in the United States we have seen new neighborhoods and rural expansion surrounding many previously smaller eastern US cities. This is in contrast to the West having greater population than geographical growth in major cities with less rural territory expansion, this evidenced by higher home prices. • Jacksonville, FL 10.6% • Orlando, FL 21.5% • Charlotte, NC 24.9% • Nashville, TN 11.0%, • Atlanta, GA 29.2% • Miami, FL 19.5% • Raleigh, NC 40.7% • *Source: USA Today http://www.usatoday.com/news/nation/census/2010-06-22-census_N.htm
DMAIC Key Point: Customers are Complaining; There’s a Problem… Scope, VOC & VOB So you’re going to be 30mins late… I had my phone with me… The jerk never called!!! SIPOC Voice of the Customer: We used the call center database to retrieve details on missed installations. The data contains customer comments about why the install was missed, the order info that was provided to the installer originally, as well as the installers reference code for the Ghost Installation. • Voice of the Business: • There are several key factors that accurate, timely, and courteous installations affect. All of which add to the success of the business, the business wants... • High Customer Satisfaction • Potential Referrals W.O.M • To Secure New Billings • Fewer Re-Installs (Rework) • Reduce Equipment Restocks • Reduce Customer Complaints I don’t care if you're stuck in traffic. I have to leave in 30mins!!!
DMAIC Key Point: KPIV’s: Traffic & Distance, KPOV: Completed Jobs KPIV,KPOV, & Data Collection • Other • Weather Cause & Effects Matrix From the results of our cause and effects matrix we can see that the key inputs (x’s) to the process are estimating traffic delays andeffectively measuring the distance from location to location ahead of leaving for the installation. Causes for Ghost Installations Based on the coded data retrieved from the data entry system it appears that the most common cause for missed appointments as stated by installers is traffic(construction, detours, accidents),followed by distance (location to location distance), communication(cannot reach customer), etc...
DMAIC Key Point: The Overall Process is Normally Distributed Measure System Analysis The frequency histograms below helped us determine that our data is normal. On the left we can see that the combined % of completed installations across both divisions is normally distributed at a rate of about 88%. To the right is the completion rate for both divisions shown independently; DSL-East’s mean is below the LL specification of 90%. West’s Benchmark
DMAIC Key Point: X’s & Y’s are in Control, Yet Not Meeting Process Specs MSA Continued Control Charts Analysis The P Chart corresponds with the histograms that about 15% of the installations are actually defective. The sample data used for the I-MR charts of traffic and distance (KPIV’s) shows us that the data is in control, although we know by the rate of defective installations (15%) that the process isn’t meeting specifications (<10%). Defectives Baseline Baseline for logged traffic times Baseline for logged distance traveled
DMAIC Key Point: GPS’s are Performing their Desired Function; Installer Can Trust the Route Information Given to Them by the GPS System MSA Continued Testing The System: We evaluated the measurement system (GPS’s) used to determine the distance from the dispatch location to a fueling station with a known distance of 2mi. We’ve imposed a tolerance level of .1 mi, and performed 50 observations. The Result: Accept Ho The P Value in the measurement system is .477 suggesting that no bias is present in the measurement system. This result preserves the H0; there is no difference in the results the GPS provides over multiple uses /users.Also, we noticed that many of the observations plotted on the run chart appear evenly distributed both above and below the reference of 2mi. The difference of the largest and smallest values = .04 which is less than our tolerance level of .1 signaling the gage (GPS) and its user(s) may be considered accurate and repeatableand therefore shouldn’t be improved. This conclusion leaves us with the unanswered question of why is distance the #2 reason for GI’s?
DMAIC Key Point: GPS’s are Performing their Desired Function, Estimating the Area Traffic Isn’t Proving to be a Consistent Method Across Installers MSA Continued Testing The Operators vs. The System: Three locations were selected that represent the expected range of the process variation. Three operators measured the expected traffic times for the three locations (assuming no special circumstances), three different days per location, in a random order. Understanding The Results: In the Components of Variation graph (located in the upper left corner), the percent contributionfrom Total Gage R&R (97.97) is larger than that of Part-To-Part (2.03). Thus, most of the variation arises from the measuring system (estimating traffic times) not the locations themselves. In the Xbar Chart by Operator most of the points in the X and R chart are inside the control limits, indicating the observed variation is mainly due to the measurement system.In the By Part graph (located in upper right corner), there is little difference between parts, as shown by the nearly level line. The Total Gage R&R accounts for 98.98% of the study variation. The measurement system of individual drivers estimating traffic times/conditions is unacceptable and should be improved.
DMAIC Key Point: The Process is 5% below the Lower Specs, We Now Have Clues as to Why MSA Continued The Result: Here we’ve displayed the Current State of DSL-East Completed Installs, we can see that the DSL-East division is currently completing only 85% of their installations on average, we can expect performance below our specified (LSL) completion rate of 90%, 96% of the time. This process is incapable of meeting the specs and must be corrected!
DMAIC Key Point: The Process is Incapable of Meeting Specification Process Capability Capability Analysis: Running a capability analysis we confirmed that the DSL-East division is yielding 85% of their installations on average, with 15% of all installations being defective, producing 150,000 defectives per million opportunities. With a yield of less than 6%, and a dismal long term process sigma of .1, we must reduce process variability and move into the spec range. • We currently run the risk of being out of the spec range 95% of the time. * Capability Analysis Courtesy of Thomas A. Little Consulting * Defects = Defectives : There are no defects for GI’s, the job is simply defective if the installer found no one present or no location to perform the install .
DMAIC Key Point: Missed Installs Causes Rework & Increased Costs Current State Process Map • VOC • Opportunity • Ends the process • Starts the Process Causes Rework • VOC • Opportunity • Ends the process Causes Rework • Cost of Poor Quality • Poor execution of this process leads to… • Costly Rework • Worker Inefficiency (overstaffing) • Equipment Restocking • Lost Business Opportunities • Low Customer Satisfaction • Rise in Customer Complaints • Low Return on Investments • Ends the process Causes Rework • VOC • Opportunity • Ends the process
DMAIC Environment Environment Machinery Machinery Materials Materials Source for Traffic Info Slow Responses from GPS Poor Weather Determining Distance Address not visible Waiting in Traffic Road Blocks Fuel Needs Severe Weather GPS Cannot Find Loc. Missing Equipment Unfamiliar with Area GPS Use Not Mandatory No way to gauge changes No Local Familiarity Poor Time Estimates Training Training Measurement Measurement Methods Methods Man Man Installation Times (am,pm) Key Point: Brainstorming on Possible Causes of KPIV’s Ishikawa (Fishbone) Diagrams • Why is traffic causing Ghost Installations? Construction GPS has no traffic function No Standard Policies Radius too wide Route Errors Are the GPS Systems Out of Date? Too Much Traffic Doesn’t Display Traffic Wide Service Area Use Personal Experience
DMAIC Key Point: Critical Effects: 1) Est. Traffic 2) Est. Distance 3) Customer Communication FMEA Failure Modes & Effects Analysis: Walking through the FMEA process has allowed us to assign values to critical process inputs so that we can prioritize our corrective efforts. • Ah Ha… Installers Discretion Causes Errors in Distance Measurements!!!
DMAIC Key Point: Traffic & Distance Have the Most Significant Effect on Travel Times; Also GI’s vs. Customer Complaints p-value = .000 Root Cause & DOE Analysis 2009 Common Causes of GI’s Defect Inputs: Pareto The Pareto chart illustrates that over 80% of GI’s are due to the top 3 causes (x’s). Traffic - 40.2% Dist. - 26.6% Comm. - 16.6% Interaction Plot: Time The non parallel lines found across all the interactions indicate that at high levels of any 2 of the factors (traffic, distance, temp.) the response (travel time) will increase. Scale: 3= High, 2= Med, 1= Low 1206 798 498 312 186 Regression: Reject H0 The p-value in the Analysis of Variance table (0.000), indicates that the relationship between defects (x) and customer complaints (y) is statistically significant at an alpha level of .05. Because there is significance in the rate of complaints versus GI’s we must reject H0: That there is no significance between the two occurrences, and accept the alternative. DOE: Pareto Effects This chart indicates that all the main effects are significant although weather (temp.) much less than the others. We can also see the interactions that are significant are Traffic and Distance or all 3. In the analysis of variance table Traffic * Distance (p = 0.021), and main effects are significant.
DMAIC Key Point: 3 Main Areas Identified for Improvement Opportunities Future StateBrainstorming Potential Solutions * solutions in green text can be implemented immediately • Technology: • Upgrade to GPS w/ Live Traffic Conditions • Upgrade to GPS that provides alternative routing • Text Weather Alerts • Automated Calling - Confirmation System • Training: • GPS Features • Route Selection • Time Management • Quarterly Service Area Briefings • Policy & Procedures: • No Discretionary Routes • Require Customer Confirmation Before Traveling to Site • Post New Obstructions • Assign Drivers as Locally as Possible to Their Neighborhood • Hand-Off Routing (Flexible Ad-HOC Dispatching) Construction Starts Downtown October 2nd
DMAIC Key Point: Top Three Solutions Identified at Kaizen Event Future StateBrainstorming • When possible… • Why not move up waiting • customers by dispatching • close-by waiting installers? Prioritization of Solutions
DMAIC Key Point: Over Our 3 Month Trial Period Major Overall Gains Have Been Made Regarding Installation Attempts Pilot Testing of Solutions Forecasted Reductions Shows We’ll Beat Our Historical Benchmark!!! • Defects Reduction: • 52% Overall Defective Reduction Achieved • Traffic, Communication, and Distance Have the Most Improvement • Traffic Times: • Ave. In-Traffic Times Reduced by -24% • -8mins • Logged Traffic Delay Counts Down by 67% Updated GPS Technology w/Alternate Traffic Views Reduced Traffic Counts Flexible Dispatching Reduced Ave. Distance Traveled • Distance Logged: • Ave. Distance Reduced by -14% • -3mi • Logged Traffic Delay Counts Down by 37%
DMAIC Key Point: The Percentage of Completed Installs Has Risen Into the Specification Area. Hypothesis Testing In-Spec Area Two Sample T-Test Non-Spec Area The Boxplot and Value Plot of before and after completed installations shows the expected average % of completed jobs has risen to meet specs of > 90% , and will slightly surpass the prior historical baselineof 92%. After Improvements Before Improvements
DMAIC Key Point: Process Capability is Higher and Complaints Will Decline by > 30% and Below All Historical Levels by Year End Improved Yield Analysis Post Improvement Capability With the defective installs slashed by 52% we can expect to achieve an acceptable yield of 93% of all jobs completed without GI issues. We can also see below that customers complaints are decreasing in response to the improvements in service delivery. I’m telling you Homer, the guy was on time and did a great job! May 2010 Improvements Implemented! * Capability Analysis Courtesy of Thomas A. Little Consulting
DMAIC Key Point: Capability Analysis Shows on Average We Can Now Expect to Meet Service Specifications Forecasted Process Capability This Process Simply Missed the Mark Before Our Analysis. Now We are on Target and Ready to Fully Implement the Solution!
DMAIC Key Point: Key Process Improvements: 1) Increased Efficiency 2) Increased Customer Contact 3) Key SOP’s are Now in Place Updated ProcessMap w/SOPs SOP-Process Improvement Steps SOP-Customer Interaction Gather VOC Gather VOC Gather VOC
DMAIC Key Point: Defectives and Customer Complaints Due to GI’s are Now In Control After the Improvements Process Monitoringvia Control Charts
DMAIC Key Point: Through Project Improvement Efforts We Have Created $276,000 in Total Benefits for the next 12mo., and $196,400 in Reoccurring Annual Revenues Financial Benefits Summary (Ex-Equipment)
DMAIC Questions orComments? Thank You for Your Time Ghost Installation Reduction Project