Download
1 / 53
530 likes | 646 Views
Harmonized 2003 & 2004 XCH4 data from 15 FTIR sites applied to global validation of SCIAMACHY IMAP-DOAS v49 and WFM-DOAS v1.0: variabilities, annual cycles, biases R. Sussmann, F. Forster, T. Borsdorff, B. Dils, M. De Mazière, C. Vigouroux, T. Blumenstock,

E N D
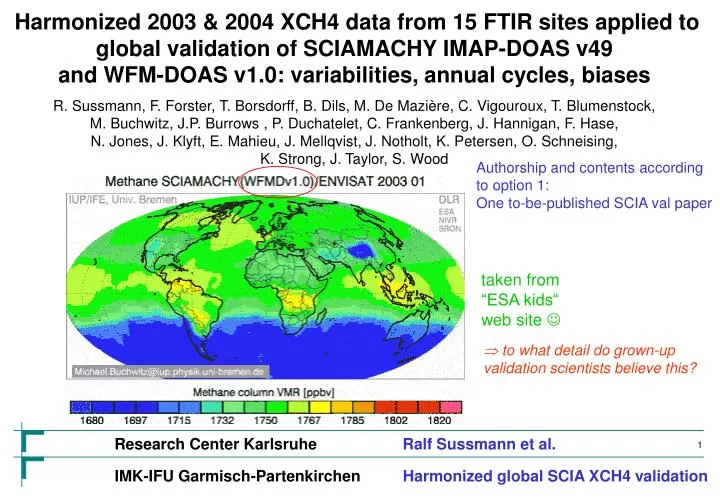
Harmonized 2003 & 2004 XCH4 data from 15 FTIR sites applied to global validation of SCIAMACHY IMAP-DOAS v49 and WFM-DOAS v1.0: variabilities, annual cycles, biases R. Sussmann, F. Forster, T. Borsdorff, B. Dils, M. De Mazière, C. Vigouroux, T. Blumenstock, M. Buchwitz, J.P. Burrows , P. Duchatelet, C. Frankenberg, J. Hannigan, F. Hase, N. Jones, J. Klyft, E. Mahieu, J. Mellqvist, J. Notholt, K. Petersen, O. Schneising, K. Strong, J. Taylor, S. Wood Authorship and contents according to option 1: One to-be-published SCIA val paper taken from “ESA kids“ web site to what detail do grown-up validation scientists believe this?
Conclusions from ACP (2005)*: SCIA WFMD v0.41 versus FTIR • Zugspitze FTIR: • precision of daily means is 0.4 % • can retrieve true annual-cycle amplitude: 1 % • can retrieve true day-to-day variability: 1 % • SCIAMACHY WFMD v0.41: • time-dependent biases 3 %/month due to icing problems in channel 8 • could not retrieve true day-to-day variability • “precision of the daily means 0.6 % (calculated from the individual pixels, 1000-km selection radius) would be sufficient to capture true day-to-day variability and the annual cycle • - if the icing issue could be eliminated”. SCIA 2000 km daily means SCIA 1000 km daily means Zugspitze FTIR daily means 2003 * Sussmann, Stremme, Buchwitz, de Beek, Atmos. Chem. Phys, 5., 2419–2429, 2005
New questions/requirements for validating IMAP-DOAS v49 & WFM-DOAS v1.0 non-HYMN but M. Buchwitz asked me to participate • Meanwhile, the icing issue was overcome by • re-implementing the SCIA retrievals from channel 8 to channel 6. • Questions/requirements for validation of newest IMAP-DOAS v49 and WFM-DOAS v1.0: • Question 2.1: Can the new SCIA channel 6 retrievals capture true day-to-day variability? • Requirement 2.1: Make sure that g.-b. FTIR can be used as a reference, i.e., can capture the true day-to-day variability – already shown by Sussmann et al. [2005]. • Question 2.2: Can the new SCIA retrievals reflect annual cycles as seen by FTIR? • Requirement 2.2: Check whether g.-b. FTIR really reflects true XCH4 annual cycles: investigate possible influences to the annual cycles derived from g.-b. retrievals. • Question 2.3: Since the dominant source of error (time-dependent biases) has been overcome it makes now sense to perform a global validation of biases. Question: is there a latitudinal dependency of biases for IMAP-DOAS v49 and WFM-DOAS v1.0? • Requirement 2.3: Make sure that CH4 columns are retrieved in a perfectly consistent manner at all globally distributed ground-based FTIR stations.
FTIR retrieval homogenization: status April 2008 one common micro-window set (i.e., the “UFTIR set”) identical spectroscopic line list for all partners ? one common source of pT-input profiles ? one consistent set of a priori VMR profiles? one consistent set of regularization matrices and altitude grids? harmonized data selection / quality control?
FTIR retrieval homogenization: status May 2008 one common micro-window set (i.e., the “UFTIR set”) identical spectroscopic line list for all: HIT04 incl. Hase update common source of pT-input profiles: NCEP one consistent set of a priori profiles? one consistent set of regularization matrices and altitude grids? harmonized data selection / quality control?
status May 2008 too low spread too high spread
FTIR retrieval homogenization: a priori profiles • basis: Toon CH4 balloon profile • mean tropopause altitudes derived from NCEP consistent to Remedios climatology
dofs 1 dofs 0 dofs 0.5 dofs 3 dofs 4 dofs 2.5 FTIR regularization: Traditional diagonal Sa - altitude-constant % VMR variabilities e.g., Rodgers and Connor, JGR, 2003
FTIR regularization: Suggested Tikhonov first-derivative (L1) regularization dofs 2 dofs 1 (VMR profile scaling) dofs 2.5 dofs 3 dofs 4
FTIR retrieval homogenization: why Tikhonov L1 : good as to profiles • Tikhonov L1 profiles do by no means look worse than • with diagonal Sa if regularization strength is tuned to a reasonable value • but there is not the disadvantage of the diagonal Sa of drawing towards the a priori for low dofs
FTIR retrieval homogenization: why Tikhonov L1 : more robust as to columns …than diagonal Sa over-regularized regime (i.e., dofs 1-2): slight over-estimaton of columns scatter in case of - wrong a priori profile - bad spectra (line shape) diurnal variation AVi (i) a priori´s ( )
FTIR retrieval homogenization: why Tikhonov L1 : more robust as to columns …than diagonal Sa • whatever the L1dofs setting is, there is per definitionem never any under-estimation of columns variability (i.e., VMR profile-scaling-type) • totally over-regularized L1 (dofs1) is identical to VMR profile scaling. This is one of the best-tested retrieval approaches: it gives no profiles but good columns. • slight over-estimation of true columns variability in case of bad spectral line shapes or bad a priori together with L1 over-regularization • reducing L1 regularization strength (increasing dofs from 1) allows for some additional flexibility in the profile to account for i) true profile variations ii) line shape errors, iii) cloud impact on the spectra • gives even more precise columns than by profile scaling
FTIR retrieval homogenization: data selection / quality control … strongly impacts (validation) results on diurnal variation / precision / biases! • one-hand quality selection of the FTIR retrievals of all groups • at IFU: • 1. requested full FTIR data sets • excluding the data quality selection usually performed • (i.e., including all bad results) • 2. applied homogenized selection thresholds for all FTIR data-sets: • FTIR spectra quality (rms of the spectral fitting residuals) • SZA min-max • maximum number of iterations • outlier-threshold (deviation from daily mean) • all thresholds carefully tuned as a trade-off between • reduction of scatter versus data loss
FTIR retrieval homogenization: data selection / quality control … strongly impacts (validation) results on diurnal variation / precision / biases! i) start: raw results then: independent data selection „per dofs“; different result ensembles per dofs (“real life“) 0.4 AVi (i) ii) start: one coincident ensemble for all dofs including data sdelction (strict selection!) then random generation of different sub-ensembles 0.3 AVi (i) 0.2 0.1
FTIR retrieval homogenization: status July/August 2008 consistent set of a priori profiles: harmonized tropopause adaptation consistent set of Tikhonov L1 regularization matrices and altitude grids harmonized data selection / quality control FTIR retrieval harmonization applied to 2003 & 2004 CH4 columns/profiles for 15 sites
Validation results: the 15 FTIR stations of our validation study *non-HYMN FTIR stations that asked me to participate in our validation paper
Harmonizing the g.-b. XCH4 validation data set: how to calculate the air column • in situ p measurements not continuously available at all sites for 2003/2004 • radio sondes not available for all sites • NEP p-profiles and ECMWF in situ p available • NCEP favored because: • The forward model of the g.-b. FTIR retrievals uses NCEP pressure profiles to calculate the airmass-profile (“fas.mas” file) which is internally used to transfer VMR profiles to partial column (CH4) profiles • I.e., the air columns calculated from NCEP are i) readily available, and ii) perfectly consistent to the CH4 total columns retrieved.
Harmonizing the g.-b. XCH4 validation data set: dry versus wet XCH4 • previous SCIA validation studies derived XCH4 from FTIR via rationing by • wet air columns (derived from pressure data). • inconsistency to SCIAMACHY, which retrieves dry XCH4 • (by rationing to CO2). • FTIRs should substract the water vapor column from the air column: • where do we get water columns from? • not all FTIR groups have a maturated FTIR water retrieval; • are NCEP water columns reliable?
Harmonizing the g.-b. XCH4 validation data set: how to calculate dry XCH4 validate NCEP water columns against maturated Zugspitze FTIR water vapor column retrieval (Sussmann, Borsdorff, Camy-Peyret, 2008) NCEP water ok, use for all stations
Harmonizing the g.-b. XCH4 validation data set: dry versus wet XCH4 … impact on bias, annual cycle
Harmonizing the g.-b. XCH4 validation data set: different ray tracing algo´s e.g., at Zugspitze and Jungfraujoch …. impact on annual cycles? No. Jungfraujoch FTIR Zugspitze FTIR daily means
FTIR tropopause altitude mountain altitude SCIA pixel selection radius surface level Harmonizing the g.-b. XCH4 validation data set: altitude correction … for high altitude FTIR sites Solution a (Dils, 06): use TM4 model ratio mountain/ground as correction factor for XCH4 Drawback: spatial resolution of the model (23 °) does not correspond with SCIAMACHY pixels Solution b (IFU, 08): add CH4 a priori column between surface and mountain top, scaled by retrieved scaling factor of the column above
Validate IFU altitude correction: Zugspitze (2964 m) versus Garmisch (745 m) derived from all 2004 coincidences Zuspitze/Garmisch
tropopause altitude SCIA pixel selection radius surface level FTIR location Validation strategy: spatial co-location criteria Problem: question of appropriate spatial co-location criteria - no unique answer • Impact of selection radius on : • number of coincides • inclusion of remote sources/sinks • magnitude of dynamically induced • variability Solution: Use different collocation criteria in parallel (pixel selection radii 200 km, 500 km, 1000 km) and analyse their impact on the validation results [Sussmann et al. 2005]
Validation results: validation plots (daily means FTIR, SCIA-200, -500, -1000 km)
Validation results: validation plots (daily means FTIR, SCIA-200, -500, -1000 km)
Validation results: validation plots (daily means FTIR, SCIA-200, -500, -1000 km)
Validation results: validation plots (daily means FTIR, SCIA-200, -500, -1000 km)
Validation results: validation plots (daily means FTIR, SCIA-200, -500, -1000 km)
Validation results: validation plots (daily means FTIR, SCIA-200, -500, -1000 km)
Validation results: validation plots (daily means FTIR, SCIA-200, -500, -1000 km)
Validation results: validation plots (daily means FTIR, SCIA-200, -500, -1000 km)
Validation results: validation plots (daily means FTIR, SCIA-200, -500, -1000 km)
Validation results: validation plots (daily means FTIR, SCIA-200, -500, -1000 km)
Validation results: validation plots (daily means FTIR, SCIA-200, -500, -1000 km)
Validation results: validation plots (daily means FTIR, SCIA-200, -500, -1000 km)
Validation results: validation plots (daily means FTIR, SCIA-200, -500, -1000 km)
Validation results: numbers on precisions, variabilities, and biases … 60 Tables for: - 2003 & 2004 data - 15 stations - 2 SCIA processors Table 3. Validation results. *: too few data / no significant results Frankenberg’s Data Buchwitz’s Data i : index of day AVi(ni) : average number of FTIR spectra (or SCIA pixels) per day AVi(i) : diurnal variation of individual measurements (FTIR), pixel-to-pixel scatter (SCIA) within daily selection radius AVi(i/ni) : precision of daily mean Frankenberg’s Data Buchwitz’s Data Example
Validation results: number of SCIAMACHY data Frankenberg’s Data Buchwitz’s Data i : index of day AVi(ni) : average number of FTIR spectra per day / of SCIA pixels within a certain selection radius per day Results for SCIA AVi(ni) : i) more data from IMAP compared to WFMD ii) extremely few data for WFMD at the poles iii) numbers due to differing data selection procedures
Validation results: single column measurement precision FTIR (I) i : index of day AVi(i) : diurnal variation of individual measurements (FTIR) i of day i (18 Sep) = 0.13 % ni = 9 columns, 10 min integration per column diurnal variation mainly due to clouds XCH4 different numbers due to differing data selection procedures
Validation results: single columns precision FTIR (II) • Results for FTIR AVi(i) : • i) FTIR single measurement precision is typically around 0.5 % for most sites. • It is interesting to compare the value for Zugspitze 2003 data (0.56 %) with the value of 1.3 % obtained from our older version FTIR retrievals for 2003, see Table 1 in [Sussmann et al., 2005]: Improved FTIR precision is due to the optimized FTIR profile retrieval (Tikhonov harmonizaton) compared to the simple VMR profile scaling performed in 2005. • ii) There are sites with slightly better-than-average precision (0.2-0.3 %), e.g., Jungfraujoch and Izana, which points to a very high engineering quality of the spectra and/or measurement conditions with very low cloud contamination. • iii) There are also sites with slightly reduced precision (1-2 %), e.g., Thule and Wollongong, which might be due, e.g., to high cloudiness. different numbers due to differing data selection procedures
Validation results: single columns precision SCIA (I) i : index of day AVi(i) : pixel-to-pixel variability of all SCIA columns of a day within a certain selection radius 200 km • Results for SCIA AVi(i) : • i) Pixel-to-pixel variability is typically in the order of 1.5-2.5 %. • Compare WFM-DOAS v1.0 for Zugspitze 2003 within 1000 km radius (1.60 %) with the value of 5.4 % for same radius but WFM-DOAS v0.41 [Sussmann et al., 2005]: This reflects a significant improvement in SCIA precision. • ii) Usually slight increase of AVi(i) with the selection radius (e.g., Lauder IMAP-DOAS for • 2003: 1.6 %, 2.01 %, 2.24 % for 200 km, 500 km,1000 km) – sources/sinks included. • iii) Slight decrease of AVi(i) with increasing selection radius for island sites (e.g., Izana and • St. Denis) – no soures above ocean but homogeneous ocean OH sink added. • iv) Pixel-to-pixel variability typically smaller for WFM-DOAS v1.0 by 0.5 % compared to • IMAP-DOAS v49 (in line with WFMD stronger quality control, at the cost of fewer data).
200 km Validation results: response to day-to-day variability, 2 definitions SCIA FTIR indiv. columns Remember AVi(i) = precision of a single column measurement I) ThereforeAVi(i/ni) = stat. error (precision) of a daily mean (FTIR or SCIA) II) day-to-day variability = “ of daily means corrected for annual cycle [%]” : AVi(i/sqrt (ni)) has to be smaller than the true day-today variability in order to obtain reasonable results. daily means
Validation results: response to day-to-day variability, FTIR Results FTIR i) The precision of daily mean XCH4 AVi(i/sqrt (ni)) at different stations is 0.15 % - 0.5 % with values up to 1 %, depending on the single measurement precision and the number of FTIR measurements per day. ii) The day-to-day variability (“ of daily means corrected for annual cycle [%]”) observed by FTIR is typically 0.7- 1.5 %. These numbers should be a approximation of true XCH4 day-to-day variability above the sites because the precision of the daily mean is typically a significantly smaller number, see i).
Validation results: response to day-to-day variability, SCIA (I) Results IMAP-DOAS v49 i) AVi(i/sqrt (ni)) for is typically < 0.5 % for the 200 km selection radius and is of course decreasing with higher selection radii. This means that the true day-to-day variability of 0.7- 1.5 % (as seen by FTIR) can be measured by IMAP-DOAS v1.0. iii) For the 200 km radius the limited precision of the daily means tends to slightly impact the day to-day-variability towards slightly too high values. ii) For the 500 km radius the day-to-day variability derived from IMAP-DOAS v49 typically agrees to the value found from FTIR.
tropopause altitude SCIA pixel selection radius surface level FTIR location Validation results: response to day-to-day variability, SCIA (II) … continued : Results IMAP-DOAS v49 iv) For the 1000 km radius the SCIA day-to-day variability is slightly reduced relative to what is seen by FTIR above a single site. This is exactly what we expect due to an averaging of the impact of planetary wave activity (driver of day-to-day variability) within large selection radii:
Validation results: response to day-to-day variability, SCIA (III) Result WFM-DOAS v1.0 i) The precision of the daily mean AVi(i/sqrt (ni)) is lower for WFM-DOAS v1.0 compared to IMAP-DOAS v1.0 due to the smaller number of data ni. True day-to-day variability (as seen by FTIR) can be reflected approximately, but there is a tendency for over-estimation due to the limited precision of the daily means.
Validation results: biases, latitudinal dependency (I) without altitude correction
Validation results: biases, latitudinal dependency (II) with altitude correction