Download
1 / 34
340 likes | 477 Views
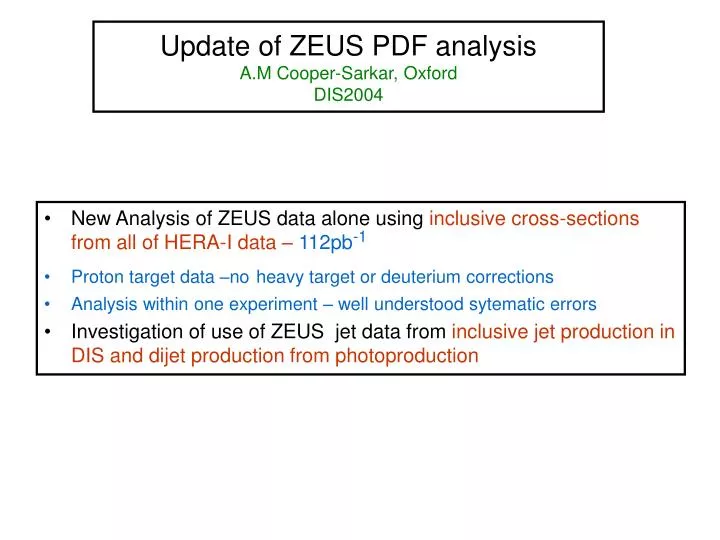
Update of ZEUS PDF analysis A.M Cooper-Sarkar, Oxford DIS2004. New Analysis of ZEUS data alone using inclusive cross-sections from all of HERA-I data – 112pb -1 Proton target data –no heavy target or deuterium corrections Analysis within one experiment – well understood sytematic errors

E N D
Update of ZEUS PDF analysisA.M Cooper-Sarkar, OxfordDIS2004 • New Analysis of ZEUS data alone using inclusive cross-sections from all of HERA-I data – 112pb-1 • Proton target data–noheavy target or deuterium corrections • Analysis within one experiment – well understood sytematic errors • Investigation of use of ZEUS jet data from inclusive jet production in DIS and dijet production from photoproduction
Published GLOBAL ZEUS-S fits to 30 pb-1 of ZEUS 96/97 NC e+ differential cross-section data and fixed target DIS structure function data from BCDMS, E665, NMC on D and P targets and from CCFR on Fe target Phys. Rev. D67,012007(2003) (hep-ex/0208023) Central PDFs and error analysis available on Durham HEPDATA http://durpdg.dur.ac.uk/hepdata/zeus2002.html as eigenvector PDF sets in LHAPDF compatible format Where does the information come from in a global PDF fit like ZEUS-S? Valence: xF3 ~ x(uv +dv) from neutrino-Fe heavy target data F2n/F2p ~ xdv/xuv at high-x from μ D/p data Sea: Low-x from ZEUS F2 e p data High-x dominantly from fixed target F2 μ p data Flavour structure from μ D and p Gluon: Low-x from ZEUS dF2/dlnQ2 e p data High-x from mom-sum rule only- Plus F2 l p data at high-x dominantly measure uv
Now use ALL inclusive cross-section data from HERA-I 102 pb-1 96/97 e+p NC 30 pb-1 2.7 < Q2 < 30000 GeV2 242 d.p. 10 corr..err. 2 norms 94-97 e+p CC 33 pb-1 280. < Q2 < 30000 GeV2 29 d.p. 3 corr. err. 98/99 e-p NC 16 pb-1 200 < Q2 < 30000 GeV2 92 d.p. 6 corr err. 1 norm 98/99 e-p CC 16 pb-1 200 < Q2 < 30000 GeV2 26 d.p. 3 corr. err. 99/00 e+p NC 63 pb-1 200 < Q2 < 30000 GeV2 90 d.p. 8 corr. err. 1 norm 99/00 e+p CC 61 pb-1 200 < Q2 < 30000 GeV2 29 d.p. 3 corr. err. Where does the information come from in a ZEUS-Only fit Valence: High-Q2 cross-sections CC/NC e+/- Sea:Low-x from the ZEUS NC 96/7 `all’ Q2 sample. High x ? Flavour structure? Gluon: Low-x from ZEUS NC96/7 ‘all’ Q2, dF2/dlnQ2 data. High-x from mom-sum rule only On a pure proton target- no heavy target correction or deuterium corrections
HERA at high Q2 Z0 and W+/- exchanges become important for NC processes F2= 3i Ai(Q2) [xqi(x,Q2) + xqi(x,Q2)] xF3= 3iBi(Q2) [xqi(x,Q2) - xqi(x,Q2)] Ai(Q2) = ei2 – 2 eivi vePZ + (ve2+ae2)(vi2+ai2) PZ2 Bi(Q2) = – 2 eiai ae PZ + 4ai ae vi ve PZ2 PZ2 = Q2/(Q2 + M2Z) 1/sin2W • Z exchange gives a new valence structure function xF3 measurable from low to high x- on a pure proton target
CC processes give flavour information d2s(e+p) = GF2 M4W [x (u+c) + (1-y)2x (d+s)] d2s(e-p) = GF2 M4W [x (u+c) + (1-y)2x (d+s)] dxdy 2px(Q2+M2W)2 dxdy 2px(Q2+M2W)2 uv at high x dv at high x Measurement of high x, d-valence on a pure proton target. NC processes dominantly measure u- valence. Fixed target measurement of d-valence is from Fe/Deuterium target – needs corrections even for Deuterium
Recap of the method Parametrize parton distribution functions PDFs at Q20 = 7 Gev2 Evolve in Q2 using NLO DGLAP (QCDNUM 16.12) Convolute PDFs with coefficient functions to give structure functions and hence cross-sections Coefficient functions incorporate treatment of Heavy Quarks by Thorne-Roberts Variable Flavour Number Fit to data under the cuts, W2 > 20 GeV2 (to remove higher twist), 30,000 > Q2 > 2.7 GeV2 x > 6.3 10-5 • xuv(x) = Au xav(1-x)bu(1 + cu x)xdv(x) = Ad xav(1-x)bd(1 + cd x) xS(x) = As xas(1-x)bs(1 + cs x)xg(x) = Ag xag(1-x)bg(1 + cg x) xΔ(x) = x(d-u) = AΔxav(1-x)bs+2 Model choices Form of parametrization at Q20, value ofQ20,, flavour structure of sea, cuts applied, heavy flavour scheme ←Use of NLO DGLAP
The χ2 includes the contribution of correlated systematic errors χ2 = 3i [ FiQCD(p) –38 slDilSYS – FiMEAS]2 + 3 sl2 (siSTAT) 2 Where ΔiλSYS is the correlated error on point i due to systematic error source λ ands8are systematic uncertainty fit parameters of zero mean and unit variance This has modified the fit prediction by each source of systematic uncertainty The statistical errors on the fit parameters, p, are evaluated fromΔχ2 = 1, sλ=0 The correlated systematic errors are evaluated by the Offset method –conservative method - sλ=±1 for each source of systematic error For the global fit the Offset method gives total errors which are significantly larger than the Hessian method, in which sλ varies for the central fit. This reflects tensions between many different data sets (no raise of χ2 tolerance is needed) It yields an error band which is large enough to encompass the usual variations of model choice (variation of Q20, form of parametrization, kinematic cuts applied) Now use ZEUS data alone - minimizes data inconsistency (but must consider model dependence carefully)
Using restricted data sets makes us more vulnerable to model dependence Major source of model dependence is the form of the parametrization at Q20 No χ2 advantage in more terms in the polynomial No sensitivity to shape of Δ= d – u Assume s = (d+u)/4 consistent with ν dimuon data • xuv(x) = Au xav(1-x)bu(1 + cu x)xdv(x) = Ad xav(1-x)bd(1 + cd x) xS(x) = As xas(1-x)bs(1 + cs x)xg(x) = Ag xag(1-x)bg(1 + cg x) xΔ(x) = AΔxav(1-x)bs+2 These parameters control the low-x shape These parameters control the high-x shape These parameters control the middling-x shape Au, Ad, Ag are fixed by the number and momentum sum-rules Little low-x valence information to distinguish av for u and d valence → 13 parameters for a global fit But with ZEUS data alone we lose information/sensitivity to AΔ – fix to value consistent with Gottfried sum-rule We also lose information on the high-x Sea and gluon
Compare the uncertainties for uv, dv, Sea and glue in a global fit uv dv Sea Gluon High-x Sea and Gluon are considerably less well determined than high-x valence (note log scales) even in a global fit - this gets worse when fitting ZEUS data alone Compare the uncertainties for uv, dv, Sea and glue in a fit to ZEUS data alone uv and dv are now determined by the ZEUS highQ2 data not by fixed target data and precision is comparable- particularly for dv Sea and gluon at low-x are determined by ZEUS data with comparable precision for both fits – but at mid/high-x precision is much worse
STRATEGY A: Constrain high-x Sea and gluon parameters • xf(x) = A xa(1-x)b(1 + c x) • The fit is not able to reliably determine both b and c parameters for the Sea and the gluon – these parameters are highly correlated • We could either • Choose a simpler parametrization: xf(x) = A xa (1-x)b • Fix parameter b to the value from the ZEUS-S global fit, and vary this value between the one σ errors determined in that fit xf(x) = A xa (1-x)b±Δb(1+cx) • Choice 1. would not allow structure in the mid x Sea/gluon distributions even in principle (recall the difference in H1 and ZEUS published gluons) • Thus choice 2 is made for the central 10 parameter ZEUS – Only fit • In practice choice 1. and 2. give very similar results
Zeus-Only Zeus and H1 gluons are rather different even when these data are used in the same analysis - AMCS H1-Only
Model errors: Percentage difference in choice 1 and choice 2 vs uncertainties on central fit Percentage difference Sea choice 1 + gluon choice 2. to Sea choice 2 + gluon choice 2 Percentage difference Sea choice 1 + gluon choice 1. to Sea choice 2 + gluon choice 2
Compare valence partons for ZEUS-S global fit and ZEUS-Only fit • Global fit uncertainty is systematics dominated whereas ZEUS-Only fit is statistics dominated- much improvement expected from HERA-II, particularly if there is lower energy running to access higher-x • ZEUS-Only fit uses proton target data only- particularly important for dv
Gluon and Sea are similar to the global fit – same information at low-x -- by construction at higher-x
Compare ZEUS-Only fit to ZEUS-S global fit and to MRST-2001 Compare ZEUS-Only fit to H1-Only fit
STRATEGY B: Use more data to tie down the high-x gluon What data? Published Jet production data from 96/97 30 pb-1 Di-jet photproduction cross-sections vs ET(lab) in bins of rapidity for direct photons (xγ > 0.75) Inclusive jet cross-sections vs ET(Breit) for DIS in bins of Q2
How? NLO QCD predictions for jet production: DISENT for DIS jets, FRIXIONE and RIDOLFI for photoproduced di-jets are too slow to be used every iteration of a fit. Thus these codes are used to produce grids in (x, μF2), for each cross-section bin and each flavour of parton (gluon, up-type, down-type). The predictions must also be multiplied by hadronization corrections and ZO corrections The calorimeter energy scale and the luminosity are treated as correlated systematic errors μF= Q for the DIS jets, μR=Q or ET as a cross-check μR= μF = ET/2 for the γ di-jets (ET is summed ET of final state partons), the AFG photon PDF is used but only direct photon events are used to minimize senstivity This is how well the grids reproduce the predictions – to 0.05%
Retain a, b, c all free in gluon param. • xg(x) = Ag xag(1-x)bg (1 + cg x) • →11 parameter fit • The improvement in the determination of the gluon distribution at moderate to high-x is quite striking • Although the jet data mostly affect 0.01<x<0.1(region of visible difference in the H1/ZEUS gluons)the momentum sum-rule transfers some of this improvement to higher-x • The Sea distribution is not significantly improved and we maintain our previous strategy of constraining a high-x sea parameter (choices 1 or 2 are very similar) • For a better high-x Sea determination we await HERA-II (and low energy running?) Improvement in gluon determination without jets → with jets 11 parameter fits
The ZEUS-Only fit including jet data compared to the inclusive cross-section data
The ZEUS-Only fit with Jets compared to DIS inclusive jet data
The ZEUS-Only fit with jets compared to di-jet photoproduction data Less goodNLOQCD description of data at the lowest ET → hence a cross-check removing the lowest ET bin from both DIS and Photoproduction Jet data was made
Sea/gluon STRATEGY A Sea/gluon STRATEGY B
Valence STRATEGY A Valence STRATEGY B
Strategy A (constrain high-x Sea/Gluon) Strategy B (use jet data to determine high-x gluon)
SUMMARY AND CONCLUSION • PDF Analysis of ZEUS data alone reduces the uncertainty involved in the combination of correlated systematic errors from many different experiments with possible incompatibilities • Using ZEUS data alone also avoids uncertainty due to heavy target corrections for Fe and Deuterium– particularly important for d valence • ZEUS data now cover a large range in the x,Q2 kinematic plane • → Valence is well measured → low-x Sea/gluon are well measured • Adding jet data gives a significant constraint on the mid/higher x gluon • → There’s a lot more that could be done – Use more jet cross-sections • Add jet data from 1998/2000 • Add charm differential cross-sections in ET and rapidity • Add resolved photon xsecns (if can control the photon PDF uncertainty) • Add HERA-II data for: more accurate valence ( xF3 from NC/ flavours from CC) : more accurate high-x Sea • Low energy running at HERA-II → for higher x and for FL → Gluon αs measurement
ZEUS with jets STRATEGY-B ZEUS Without jets
Improvement in sea determination without jets → with jets 11 parameter fits STRATEGY-B
The χ2 includes the contribution of correlated systematic errors χ2 = 3i [ FiQCD(p) –38 slDilSYS – FiMEAS]2 + 3 sl2 (siSTAT) 2 • Where ΔiλSYS is the correlated error on point i due to systematic error source λ ands8are systematic uncertainty fit parameters of zero mean and unit variance • This has modified the fit prediction by each source of systematic uncertainty • The statistical errors on the fit parameters, p, are evaluated fromΔχ2 = 1 • The correlated systematic errors are evaluated by the Offset method –conservative method • Perform fit without correlated errors (sλ = 0) for central fit • Shift measurement to upper limit of one of its systematic uncertainties (sλ = +1) • Redo fit, record differences of parameters from those of step 1 • Repeat 2-3 for lower limit (sλ = -1) • Repeat 2-4 for next source of systematic uncertainty • Add all deviations from central fit in quadrature (positive and negative deviations added in quadrature separately) • Does not assume that correlated systematic uncertainties are Gaussian distributed
Offset method gives smaller errors than the Hessian method in which sλ varies for the central fit Offset method Hessian method T=1 Hessian method T=7 Hessian method gives comparable size of error band as the Offset method, when its tolerance is raised to T ~ 7– (similar ball park to CTEQ, T=10) Note this makes the Offset method error band large enough to encompass reasonable variations of model choice since the criterion for acceptability of an alternative hypothesis, or model, is that χ2 lie in the range N ± √2N, where N is the number of degrees of freedom. For the ZEUS-S global fit √2N=50. Using ZEUS data alone - consistency of data sets - mimimizes difference between Hessian and Offset method errors – study indicates T ~ 2 (and most of it is norms.)