Download
1 / 54
590 likes | 756 Views
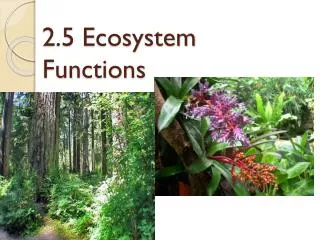
Ecosystem Functions and Services in IWRM. Interactions between ecosystems and other water use sectors. At the end of this session, participants will be able to:. describe major water use sectors identify impacts of water use sectors on ecosystem services

E N D
Ecosystem Functions and Services in IWRM Interactions between ecosystems and other water use sectors
At the end of this session, participants will be able to: • describe major water use sectors • identify impacts of water use sectors on ecosystem services • propose measures to mitigate these impacts
Water crisis? Renewable water: approximately 40,000 km3/year: • at 6 billion in 2000, that is 6,600 m3/person/year • at 8 billion in 2025, that is 4,800 m3/person/year So, what is the problem? Flows, if evenly distributed, far above the limits for … • water stress < 1700 m3/person/year • water scarcity < 1000 m3/person/year
But flows are not evenly distributed..... In quality
Increasing water scarcity Map 8.1 WWA3
Water use sectors: competition for a scarce resource What are the main water use sectors? • Agriculture/aquaculture • Industry/mining/energy/transport • Domestic (drinking water, sanitation, wastewater)
Agriculture: crops/livestock • Use of rainwater, surface water, groundwater (NB vulnerable to impacts of climate change) • Conversion and drainage of land, wetlands Resulting impacts: • Reservoirs for irrigation - changed flow patterns, increased evaporative losses • Abstracting groundwater - depletion of aquifers, lowering water tables, depleting wetlands, salt water intrusion • Land degradation - erosion (>siltation) • Pollution surface water and groundwater (nutrients, pesticides) • Fragmentation, loss of habitats
Water for irrigation • 17% of cropland is irrigated, which • produces 1/3 of world food supply • uses ± 70% of water for human use • < 50% of water reaches the crops • The rest leaks from pipes/canals, evaporates, and re-enters hydrological cycle, degraded by pesticides, fertilizers • This causes surface-/groundwater pollution while wasting chemicals
Aquaculture • Conversion of wetlands, mangroves • Use of surface water, groundwater Resulting impacts: • Loss of habitats • Pollution surface water (organic matter, nutrients, pharmaceuticals)
Industry/mining • Extraction of surface water, groundwater • Discharge of wastewater Resulting impacts: • Pollution (thermal, chemicals, metals, sediments)
Energy • Cooling water gas/coal/nuclear power plants • Hydropower (small turbines, dams) • Biofuels (~agriculture) Resulting impacts: • Thermal pollution • Altered flow patterns • Retention nutrients, sediments • Competition with food production
Transport • Rivers, lakes, estuaries Resulting impacts: • Regulated rivers - altered flow patterns • Harbours - habitat destruction • Pollution
Domestic • Use of surface water (rivers), groundwater, desalinised seawater • Production of wastewater Resulting impacts: • Depletion of aquifers, lowering of water tables • Spread of waterborne diseases • Eutrophication of surface waters
Case studies • Wastewater: organic pollution, eutrophication and dead zones • River regulation: loss of floodplains • Water for irrigation: Aral Sea and Aswan dam
What is eutrophication? Increasing nutrient levels in an (aquatic) ecosystem, through direct input or by degradation of organic matter Causes: • natural (weathering, soil erosion) • 'cultural' (human waste, agriculture, industry) Impacts: • algal/plant growth • biomass (organic matter) accumulation • oxygen depletion
Changes in river quality downstream untreated sewage outfall Hynes 1960) www.bbc.co.uk
Impact sewage outfall on river communities (Cunningham et al. 2003)
Eutrophication (adapted from Zevenboom et al. 1991) environmental conditions environmental conditions increased nutrients - + algal diversity algal biomass + + + production turbidity nuisance algal blooms +/- - oxygen light + - toxins - - macrophytes fish - - - - drinking water recreation community structure
Eutrophication (Bricker et al. 2007)
Decline seagrass Cockburn Sound, W. Australia (Cambridge & McComb 1984)
Nitrogen loads entering Cockburn Sound (Cambridge et al. 1986) increased N: epiphytes, reduced light phytoplankton: further reduction light thinned canopy: vulnerable to grazing
Distribution hypoxic (dead) zones • In 1960 there were 9 documented dead zones; this number has since doubled every decade • In 2007, a panel of experts identified 415 eutrophic and hypoxic coastal systems covering more than 245,000 km2 of water area worldwide
Eutrophication North Sea (Min. Transport & Public Works 1991) Exceptional algal blooms distribution Rhine water
Eutrophication Kattegat: anoxia Baden et al. 1990 normal O2 15% O2 5-10% O2
Causes: • high nutrient input from upstream (fertilizer) • stratification • high temperature
What could be solutions to prevent eutrophication? • wastewater treatment, including removal of nutrients • creation of buffer zones: wetlands
Wastewater management: options for resource recovery Municipal wastewater is a valuable resource: • organic matter = energy • nutrients (N,P) = protein, fertiliser • water = crops
Possible health impacts of untreated waste water discharge • 4 billion cases of diarrhoea/year. • 2.2 million deaths, mostly children under five. • 10% people in DC infected by intestinal worms. • 6 million people blind from trachoma, 500 million at risk. • 200 million people infected with schistosomiasis.
Nitrogen management NH4 Crops Protein Fish Duckweed Energy Crops Nitrification Denitrification N2 Fertiliser Energy
Storage and Recirculation Ecological toilets: use no water
Stimulate natural self-purification • allow rivers to overflow and create wetlands (prolonged retention, aeration) • construction of small dams (rapids, turbulence)
Characteristics floodplains • nutrient retention/microbiological processes • flooding frequency • lateral transport • fisheries • agriculture, aquaculture
Impacts reduced floodplain areas • nutrient retention/spiralling • habitat destruction spawning fish • flash floods
Life history atlantic salmon (van Brummelen 1990; de Groot 1989)
Reservoir: from riverine to stagnant-algal blooms White Nile (Brook &Rzoska 1954) dam development waterhyacinth flow
Aswan dam: impacts of changed discharge patterns (Hargrave 1991)