Download
1 / 1
10 likes | 129 Views
How well can we determine the tropopause from coarsely resolved model data? Thomas Reichler 1 , Martin Dameris 2 , Robert Sausen 2 (1) Meteorology Department, University of Utah, Salt Lake City, UT, USA

E N D
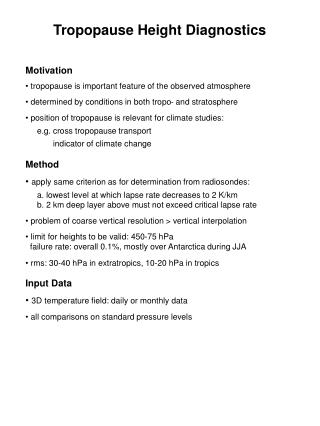
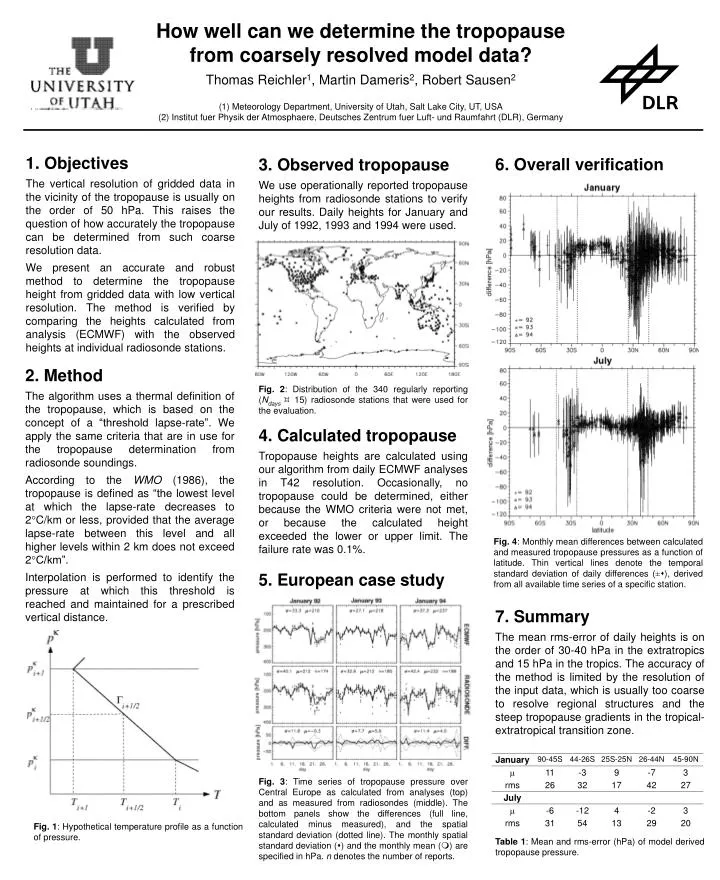
How well can we determine the tropopause from coarsely resolved model data? Thomas Reichler1, Martin Dameris2, Robert Sausen2 (1) Meteorology Department, University of Utah, Salt Lake City, UT, USA (2) Institut fuer Physik der Atmosphaere, Deutsches Zentrum fuer Luft- und Raumfahrt (DLR), Germany 1. Objectives The vertical resolution of gridded data in the vicinity of the tropopause is usually on the order of 50 hPa. This raises the question of how accurately the tropopause can be determined from such coarse resolution data. We present an accurate and robust method to determine the tropopause height from gridded data with low vertical resolution. The method is verified by comparing the heights calculated from analysis (ECMWF) with the observed heights at individual radiosonde stations. 6. Overall verification 3. Observed tropopause We use operationally reported tropopause heights from radiosonde stations to verify our results. Daily heights for January and July of 1992, 1993 and 1994 were used. 2. Method The algorithm uses a thermal definition of the tropopause, which is based on the concept of a “threshold lapse-rate”. We apply the same criteria that are in use for the tropopause determination from radiosonde soundings. According to the WMO (1986), the tropopause is defined as “the lowest level at which the lapse-rate decreases to 2°C/km or less, provided that the average lapse-rate between this level and all higher levels within 2 km does not exceed 2°C/km”. Interpolation is performed to identify the pressure at which this threshold is reached and maintained for a prescribed vertical distance. Fig. 2: Distribution of the 340 regularly reporting (Ndays 15) radiosonde stations that were used for the evaluation. 4. Calculated tropopause Tropopause heights are calculated using our algorithm from daily ECMWF analyses in T42 resolution. Occasionally, no tropopause could be determined, either because the WMO criteria were not met, or because the calculated height exceeded the lower or upper limit. The failure rate was 0.1%. Fig. 4: Monthly mean differences between calculated and measured tropopause pressures as a function of latitude. Thin vertical lines denote the temporal standard deviation of daily differences (±), derived from all available time series of a specific station. 5. European case study 7. Summary The mean rms-error of daily heights is on the order of 30-40 hPa in the extratropics and 15 hPa in the tropics. The accuracy of the method is limited by the resolution of the input data, which is usually too coarse to resolve regional structures and the steep tropopause gradients in the tropical-extratropical transition zone. Fig. 3: Time series of tropopause pressure over Central Europe as calculated from analyses (top) and as measured from radiosondes (middle). The bottom panels show the differences (full line, calculated minus measured), and the spatial standard deviation (dotted line). The monthly spatial standard deviation () and the monthly mean () are specified in hPa. n denotes the number of reports. Fig. 1: Hypothetical temperature profile as a function of pressure. Table 1: Mean and rms-error (hPa) of model derived tropopause pressure.