Download
1 / 23
230 likes | 483 Views
Congestion Charging and Air Quality in central London 12 November 2004. Charles Buckingham Monitoring Manager, Congestion Charging Division, Transport for London. Contents 1. Background 2. Key Impacts 3. Air Quality implications. Central London’s problem in 2000.

E N D
Congestion Charging and Air Quality in central London12 November 2004 Charles Buckingham Monitoring Manager, Congestion Charging Division, Transport for London
Contents • 1. Background • 2. Key Impacts • 3. Air Quality implications
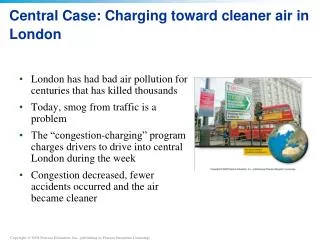
Central London’s problem in 2000 • Greater London - largest urban area in Europe, over 7 million population • Central London - 1 million workers, heart of UK business, government, media, heritage • Suffered worst traffic congestion in the UK • average traffic speeds 15 km/hr • vehicles typically spent half their time in queues • Congestion increasing, costing people and businesses time and money • General acceptance - ‘something must be done’
Key features of scheme • Inaugurated 17th February 2003 • ‘Area Licence’ scheme • £5 daily charge (discounts/exemptions) • Operational Hours 07.00 - 18.30 Weekdays • Enforced by ANPR cameras • Improved public transport • Generates net revenues for reinvestment in transport • Now 18 months on - scheme very settled and no major problems encountered
Key aims of scheme • Reduce traffic delays by between 20 and 30 percent • Reduce traffic circulating in zone by 15 percent • There was no explicit Air Quality objective for the scheme
Positive traffic changes • Traffic delays inside charging zone down 30% • Traffic delays on main routes into the charging zone down 20% • Traffic entering the charging zone down 18% • 15% less traffic circulating within the zone • Traffic continues to be successfully managed on boundary route • No significant adverse traffic impacts outside the charging zone • Driver responses to charging remain settled
Total traffic entering the charging zone during charging hours reduced by 18% Pre-Charge Post-Charge
Majority of ex-car users transferred to public transport 20-30% 15-25% 50-60% Overall congestion charging has only led to some:5000 fewer trips per day to the charging zonethis is negligible in the context of 1.5m people in the zone per day
Congestion level in the charging zone during charging hours down 30% Pre-Charge - Congestion Post-Charge - Congestion Pre- Charge - Nighttime Post-Charge - Nighttime
Time spent at various speeds 40 May/June 2002 35 May/June 2003 30 25 20 Length of time (hours) 15 10 5 0 0-10 10-20 20-30 30-40 Speed bands (km/h)
Air Quality Impacts • Congestion Charging is NOT specifically directed to improving air quality • BUT changes to volume and characteristics of traffic will AFFECT air quality
Main Air Quality Effects • Less traffic -> Less fuel -> Less emissions. • Faster average speeds and less queueing -> greater efficiency per unit distance travelled. • Changes to vehicle mix - a variety of effects, not all of which are ‘good’ • Background changes - such as fleet turnover, new buses etc. • BUT direct effects on ambient AQ unlikely to be detectable in short-medium term
EmissionsPercentage change2003/4 road traffic only (annual average)
NOx - Running annual mean concentrations Suburban Outer London Inner London - Background Within Charging Zone - Background Inner London - Roadside Inner Ring Road - Roadside Within Charging Zone - Roadside Upper Street, Islington 450 Provisional Data 400 350 -3 gm 300 m 250 Running annual mean / 200 150 100 50 0 Sep-98 Jan-99 May-99 Sep-99 Jan-00 May-00 Sep-00 Jan-01 May-01 Sep-01 Jan-02 May-02 Sep-02 Jan-03 May-03 Sep-03 Jan-04 May-04 Sep-04
NO2 - Running annual mean concentrations Suburban Outer London Inner London - Background Within Charging Zone - Background Inner London - Roadside Inner Ring Road - Roadside Within Charging Zone - Roadside Upper Street, Islington 120 Provisional Data CCS Introduced 100 -3 gm 80 m 60 Running annual mean / -3 m AQS Objective (40 gm ) 40 20 0 Sep-98 Jan-99 May-99 Sep-99 Jan-00 May-00 Sep-00 Jan-01 May-01 Sep-01 Jan-02 May-02 Sep-02 Jan-03 May-03 Sep-03 Jan-04 May-04 Sep-04
PM10 - Running annual mean exceedence days Suburban Outer London Inner London - Background Within Charging Zone - Background Inner London - Roadside Inner Ring Road - Roadside Within Charging Zone - Roadside Upper Street, Islington 180 Provisional Data 160 -3 gm 140 m 120 100 Number of days where daily mean > 50 80 60 40 2005 AQS Objective (35 days) 20 2010 AQS Objective for London (10 days) 0 Sep-98 Jan-99 May-99 Sep-99 Jan-00 May-00 Sep-00 Jan-01 May-01 Sep-01 Jan-02 May-02 Sep-02 Jan-03 May-03 Sep-03 Jan-04 May-04 Sep-04
Summary • Substantial emissions gains • Not immediately visible in monitored data • 2003 an unusual year • Other factors (e.g. NO2) ? • Not possible to demonstrate ‘benefits’, but no evidence of detrimental effects from scheme • Positive effects perceived by public
Further information Second Annual Report May 2004 www.tfl.gov.uk/tfl/cclondon/cc_monitoring.shtml