Download
1 / 22
220 likes | 222 Views
What is an image?. What is an image and which image bands are “best” for visual interpretation?. http://cbc.rs-gis.amnh.org/. An image is made up of individual elements called pixels that are arranged in a grid of rows and columns.

E N D
What is an image? What is an image and which image bands are “best” for visual interpretation? http://cbc.rs-gis.amnh.org/
An image is made up of individual elements called pixels that are arranged in a grid of rows and columns. Each pixel represents an area on the ground defined by its resolution. The resolution determines the detail that can be seen in an image. For example, a 1 meter pixel will provide more detail than a 30 meter pixel
The sensor acquires several images (bands) at once, each recording a specific color or range of colors. When viewed, each individual band looks like a black and white photograph Landsat band 2 - (wavelength range = 0.52-0.60 µm = blue light)
For each band the amount of energy (intensity) for a specific range of wavelengths (colors) is measured
At the pixel level digital numbers from three bands are converted to grayscale colors, passed through a color filter, and then composited to make a color pixel
Certain bands or band combinations are better than others for identifying specific land cover features. Landsat TM Red=band 3 Green=band 2 Blue = band 1 Landsat TM Red=band 4 Green=band 5 Blue = band 3
Landsat ETM+ band 1 (0.45-0.52 µm, blue-green) • Penetrates water better than the other bands so it is often the band of choice for aquatic ecosystems • Used to monitor sediment in water, mapping coral reefs, and water depth • The “noisiest” of the Landsat bands since short wavelength blue light is scattered more than the other bands • Rarely used for "pretty picture" type images
Landsat ETM+ band 2 (0.52-0.60 µm, green) • Similar qualities to band 1 but not as noisy • Matches the wavelength for the color green
Landsat ETM+ band 3 (0.63-0.69 µm, red) • Since vegetation absorbs nearly all red light (it is sometimes called the chlorophyll absorption band) this band can be useful for distinguishing between vegetation and soil and in monitoring vegetation health
Landsat ETM+ band 4 (0.76-0.90 µm, near infrared) • Since water absorbs nearly all light at this wavelength water bodies appear very dark. This contrasts with bright reflectance for soil and vegetation so it is a good band for defining the water/land interface • Sensitive to vegetation cover • Less affected by atmospheric contamination
Landsat ETM+ band 5 (1.55-1.75 µm, mid-infrared) • Very sensitive to moisture and is therefore used to monitor vegetation water stress and soil moisture • Useful to differentiate between clouds and snow
Landsat ETM+ band 6 (10.40-12.50 µm, thermal infrared) • Measures surface temperature • Geological applications • Differentiate clouds from bright soils since clouds tend to be very cold • The resolution is twice as course as the other bands (60 m instead of 30 m)
Landsat ETM+ band 7 (2.08-2.35 µm mid-infrared) • Can detect high surface temperatures • Also used for vegetation moisture although generally band 5 is preferred for that application • Commonly used in geology • Good at detecting burn scars
Landsat ETM+ bands 4,3,2 Peak chlorophyll, land/water boundary, urban areas Landsat ETM+ bands 3,2,1 Penetrates shallow water and shows submerged shelf, water turbidity
Landsat ETM+ bands 4,5,3 Land/water boundary, Vegetation type and condition, soil moisture Landsat ETM+ bands 7,4,2 Moisture content in vegetation and soils, geological mapping, vegetation mapping
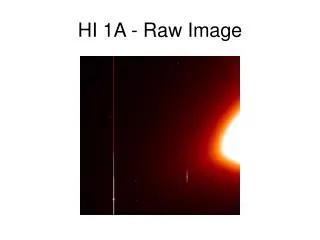
Image colors need to be enhanced to highlight specific features or simply to look nice. “Raw” values After enhancement
Image enhancement • Common enhancement tools include: • Brightness/contrast, • Linear histogram stretching, • Histogram equalization, • Customized histogram stretching, and • Many more options • Experience with different tools provides a sense for what works best for different situations. • Software tools with a graphical display of the input (before) and output (after) histogram are helpful to understand how the enhancement process works. • Enhancements can focus on a specific feature although this often produces an image that is less visually pleasing.
Image fusion • Image sharpening combines lower resolution multispectral images with a higher spatial resolution panchromatic (single, broad band) image to create a finer resolution multispectral image. • There are several algorithms for doing this and it is best to experiment with different ones to see what works best. • The sharpened image is visually more pleasing but the pixel values have been altered from the original images so automated classification methods might produce unexpected results.
Effects of image fusion Image after sharpening using Landsat ETM+ 15 meter panchromatic image Multispectral Landsat ETM+ 30 meter image before sharpening