Download
1 / 22
220 likes | 227 Views
Demand During Lead Time. Inventory. Time. ROP when demand during lead time is fixed. LT. Demand During Lead Time is Variable. LT. Demand During Lead Time is Variable. Inventory. Time. Safety Stock. Quantity. A large demand during lead time. Average demand during lead time. ROP.

E N D
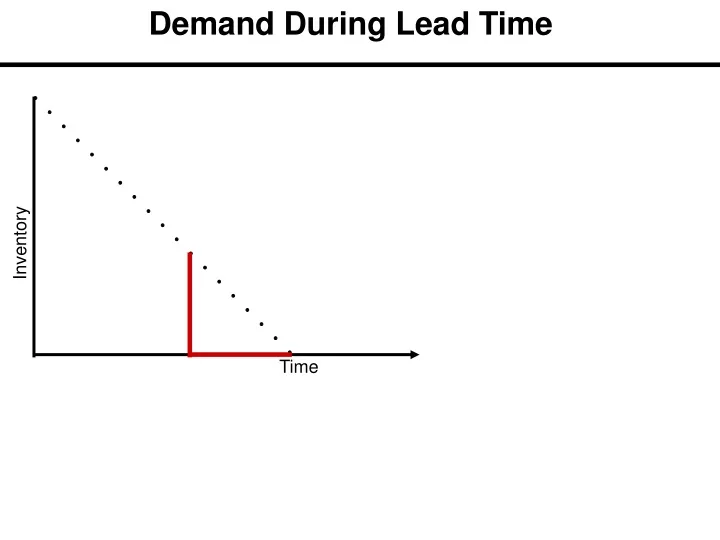
Demand During Lead Time Inventory Time
Demand During Lead Time is Variable Inventory Time
Safety Stock Quantity A large demand during lead time Average demand during lead time ROP Safety stock Time LT Safety stock reduces risk of stockout during lead time
Safety Stock Quantity ROP Time LT
When to re-order (ROP) Demand during lead time has Normal distribution. If we order when the inventory on hand is equal to the average demand during the lead time; then there is 50% chance that the demand during lead time is less than our inventory. However, there is also 50% chance that the demand during lead time is greater than our inventory, and we will be out of stock for a while. We usually do not like 50% probability of stock out We can accept some risk of being out of stock, but we usually like a risk of less than 50%.
Safety Stock and ROP Risk of a stockout Average demand Safety stock z-scale Service level Probability of no stockout ROP Quantity 0 z Each Normal variable x is associated with a standard Normal Variable z x is Normal (Average x , Standard Deviation x) z is Normal (0,1) • There is a table for z which tells us • Given anyprobability of not exceeding z. What is the value of z • Given anyvalue forz. What is the probability of not exceeding z
Common z Values Service level Risk of a stockout Probability of no stockout ROP Quantity Average demand Safety stock 0 z z-scale Risk Service level z value .1 .9 1.28 .05 .95 1.65 .01 .99 2.33
μ and σ of demand during lead time Demand of sand during lead time has an average of 50 tons Standard deviation of demand during lead time is 5 tons Assuming that the management is willing to accept a risk no more that 5%. What is the service level. Service level = 1-risk of stockout = 1-.05 = .95 Find the z value such that the probability of a standard normal variable being less than or equal to z is .95 Go to normal table, look inside the table. Find a probability close to .95. Read its z from the corresponding row and column. z=1.64
μ and σ of demand during lead time Demand of sand during lead time has an average of 50 tons Standard deviation of demand during lead time is 5 tons Assuming that the management is willing to accept a risk no more that 5% z = 1.64 What ROP? ROP = Average demand during lead time + ss ROP = 50 + 1.64(5) = 58.2 How much safety stock do we have. ROP is 58.2, Average demand during lead time = 50 ss = 58.2- 50 = 8.2 Alternatively ss = 1.64(5) = 8.2
Relationship between z and Normal Variable x Service level Risk of a stockout Probability of no stockout ROP Quantity Average demand Safety stock 0 z z-scale z = (x-Average x)/(Standard Deviation of x) x = Average x +z (Standard Deviation of x) μ = Average x σ = Standard Deviation of x Risk Service z value level .1 .9 1.28 .05 .95 1.65 .01 .99 2.33 x = μ +z σ
Relationship between z and Normal Variable ROP Service level Risk of a stockout Probability of no stockout ROP Quantity Average demand Safety stock 0 z z-scale LTD = Lead Time Demand ROP = Average LTD +z (Standard Deviation of LTD) ROP = Average LTD +ss ss = z (Standard Deviation of LTD)
Safety Stock and ROP Service level Risk of a stockout Probability of no stockout ROP Quantity Average demand Safety stock 0 z z-scale Risk Service level z value .1 .9 1.28 .05 .95 1.65 .01 .99 2.33 ss = z × (standard deviation of demand during lead time)
Demand During Lead Time is Variable N(μ,σ) Demand of sand during lead time has an average of 50 tons Standard deviation of demand during lead time is 5 tons Assuming that the management is willing to accept a risk no more that 5%. What is the service level. Service level = 1-risk of stockout = 1-.05 = .95 What is the z value corresponding to this service level? z=1.64 What is safety stock (ss) ss = z (standard deviation of demand during lead time) ss = 1.64 (5) = 8.2
μ and σ of demand during lead time What is ROP? ROP = Average demand during lead time + ss ROP = 50 + 1.64(5) = 58.2
Example 2;total demand during lead time is variable Demand of sand during lead time has an average of 75 tons Standard deviation of demand during lead time is 10 tons Assuming that the management is willing to accept a risk no more that 10%. What is the service level. Service level = 1-risk of stockout = 1-.1 = .9 Risk Service level z value .1 .9 1.28 .05 .95 1.65 .01 .99 2.33
Example 2;total demand during lead time is variable z = 1.28 What is safety stock? ss = 1.28(10) = 12.8 ROP = Average demand during lead time + ss ROP = 75 + 12.8 = 87.8 The general relationship between service level, risk, and safety stock Service level increases Risk decreases ss increases
μ and σ of demand per period and fixed LT If demand is variable and Lead time is fixed
μ and σ of demand per period and fixed LT Demand of sand has an average of 50 tons per week. Standard deviation of the weekly demand is 3 tons. Lead time is 2 weeks. Assuming that the management is willing to accept a risk no more that 10% z = 1.28
μ and σ of Lead Time and fixed demand If lead time is variable and demand is fixed
Lead Time Variable, Demand fixed Demand of sand is fixed and is 50 tons per week. The average lead time is 2 weeks. Standard deviation of lead time is 0.5 week. Assuming that the management is willing to accept a risk no more that 10%. Compute ROP and SS. Acceptable risk; 10% z = 1.28