Download
1 / 14
200 likes | 587 Views
(b) Finite energy signal. The area is simply. And the total energy. Example : A repetitive triangular waveform as shown in the Figure below. (i) Find the area, and total energy of one pulse of the waveform. (ii) Find the mean, mean square and variance of the repetitive waveform. (a). (b).

E N D
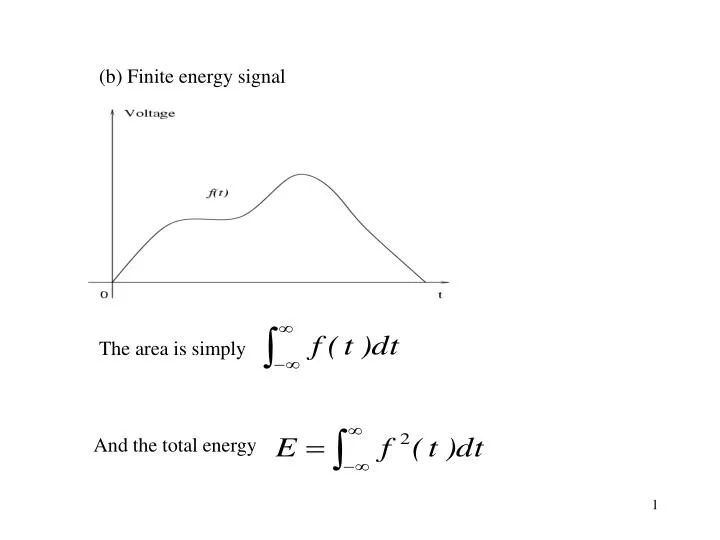
(b) Finite energy signal The area is simply And the total energy
Example: A repetitive triangular waveform as shown in the Figure below. (i) Find the area, and total energy of one pulse of the waveform. (ii) Find the mean, mean square and variance of the repetitive waveform.
(a) (b)
(ii) Frequency domain average (a) Finite mean power signals Assume that the filter passes a narrow band of frequencies of bandwidth δf , with a centre frequency f , and the gain is unity. 0 For a continuous random signal, the plot of meter reading versus centre frequency f would be similar to 0
The power spectrum P(f), sometimes called power spectral density, is the distribution of mean power per unit bandwidth, and is obtained by dividing the mean square power voltage by δf. The total mean power is given by
Example: Repetitive pulses The zero line is simply the squares of mean value, i.e. Total mean power is just the sum of the power Pn in the lines
Fourier series for the function f(t) can be written in the following trigonometric form:
%The following Matlab code rectangular.m demonstrates that a rectangular wave can be generated from a series of sine wave; clear; %clear work space; clf; %clear figure space; n=input('how many sine waves?(>2)'); %number of sine wave to be used, try changing n from small to large for better approximation; i=1:500; %500 data point; t=i/5; %5 points per time step; a(1,i)=2.5+10/pi*sin(pi*t/4); % the first sine wave plus a constant term (offset); for j=2:n; a(j,i)=10/(2*j-1)/pi*sin(pi*t*(2*j-1)/4); end; % wave forms that you generated wave_rec=sum(a); %the rectangular wave is form by summing these waves; plot(t,wave_rec); xlabel('t'); ylabel('wave forms'); hold on; plot(t,a(1,:),'r'); %the first sine wave (shown as red); plot(t,a(2,:),'g'); %the second sine wave (shown as green);
n corresponds to frequency. The amplitude versus frequency is determined by sinc function. Power spectrum takes square value of amplitude.
(b) Finite energy signals Finite energy signal (discrete) have no power spectrum, but it can be represented by a continuous energy spectrum. Total energy
Time and ensemble averages (a) Time average, e. g. (b) Ensemble average, e. g. If applied to the same signal, both must give the same value.
Consider Johnson noise produced by a large number of identical resistors Ensemble average from complete set of resistors at instant τ. Time average from any one resistor average over a long time.
Example: Triangle wave as shown below. Find the mean (shown here), mean square and variance using time average and ensemble averages. Time average: Ensemble average: