Download
1 / 32
320 likes | 504 Views
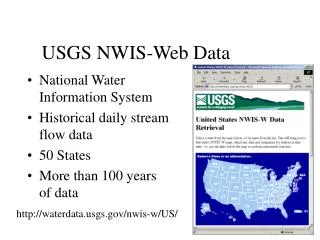
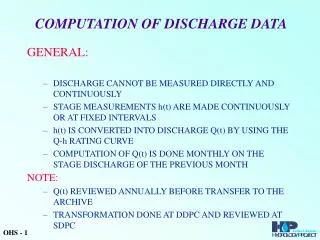
Computation of Discharge Records in NWIS. Streamflow Records Computation using ADVMs and Index-velocity Methods Office of Surface Water. Discharge Records & NWIS. This talk will focus on computing discharge records using NWIS & ADAPS!

E N D
Computation of Discharge Records in NWIS Streamflow Records Computation using ADVMs and Index-velocity Methods Office of Surface Water
Discharge Records & NWIS • This talk will focus on computing discharge records using NWIS & ADAPS! • Many aspects of computing discharge records by means of the index-velocity method are the same as computing discharge records by means of the stage-discharge method. • Considerations about tidal sites
Discharge Records - Editing Unit Values • Starting with ADAPS 4.3 the original data is preserved. • However the documentation procedures have not changed; deleting any unit values must be noted either on a unit value graph or in the station analysis
Discharge Records – Review Data • Look for velocity “spikes” – delete and/or edit as needed • Spikes are usually obvious • Very large – communications glitches • Zero or negative velocities at sites with uni-directional flow • May be harder to find for bi-directional flow sites • Establish realistic velocity thresholds in NWIS
Discharge Records – Quality Assure Data • Use all the tools at your disposal • Discharge measurements • Velocity comparisons • Multi-cell velocity • Multi-path AVM installations • QA parameters • Signal strengths, standard deviations, percent good signals, etc.
Discharge Records – Stage data • Accurate stage data are important to accurately compute the area from the stage-area rating • For shallower, wider channels, a stage error of 0.05 ft could result in a error of 3% or greater in area and Q • In a deeper channel, the same stage error could result in a error of less than 1% • Apply datum and stage corrections as needed • Acoustic stage may be used as a secondary stage sensor, but collect QA data – compare with accepted stage sensors, reference gage readings
Discharge Records – Velocity Data • Long periods of obviously erroneous velocity data may need to be deleted and the record estimated • Alternatively, a velocity shift might be utilized • A velocity shift may also be used for a temporary, explainable departure from the ratings • A velocity shift should not be used for a major, more permanent rating change
Velocity Shifts • Exercise great when applying shifts! Review presentation on velocity shifts • Low-flow shifts often are not warranted as ADVM noise can dominate in low velocity • Shifts are valid only over the range of measured discharge • Shifts should be temporary. Do not use to represent a permanent rating change • Should be evaluated through measurement data and/or hydrographic analysis
Discharge Records – Example Shift • Station: Fall Creek at Millersville • Period: 12/1/00 – 2/28/01 • Debris evidently gathered in ADVM cell 2 • This produced a negative (low) bias in velocity • Estimated the bias by comparing cell 1 velocity with cell 2 velocity over time • Correct bias with positive Vi shifts
Discharge Records –Primary Computations • Use discharge as the Data Descriptor (DD) • The standard primary computation option is recommended for index-velocity sites. The output from the standard option will have stage and velocity corrections and velocity shifts shown. There is not enough room on the historical primaries for everything.
Discharge Records – Hydrographic Comparison Analysis • Use hydrographic comparison and available weather data to evaluate the hydrograph • Make sure peak discharges are valid • Evaluate periods when shifts were applied • Estimate discharges for periods of missing or invalid data
Discharge Records – Ice-affected Periods • If the instrument is equipped with an upward-looking acoustic stage sensor, it could be used to estimate area under ice • Because velocity profiles for flow under ice may be altered (as compared with open-channel flow), the index-velocities might need to be adjusted; i.e.. might have a separate rating for flow under ice • Ice measurements should be made to verify record
Discharge Records – Rating the Record • Use percent differences (discharge measurement departures) as a guide to quality of the record • Consider downgrading record for the following: • When ratings are extended (without Qms) • New ratings with small number of Qms • Records are based on periods of questionable velocity data
Discharge Records – Documentation • Document your records showing: • All pertinent info for rating development process • Plots of velocity and stage and ancillary data • Primary computation output • Discharge hydrographs • Other supporting data
Considerations for Tidal Data • Topics: • Tidal Station Ratings • Data Publication • Become familiar with OSW Technical Memo 2010.08 (revised on Sept 26, 2011). “Processing and Publication of Discharge and Stage Data Collected in Tidally-Influenced Areas”
Tidal Station Ratings • Basic rating process the same as a non-tidal system. • Poor site selection can cause an unforgiving rating. • Multiple series of 13-hour discharge measurements are recommended. • These measurements series can be used to evaluate differences between ratings to help determine error or bias that may be associated with a rating.
Loops or Separation Possible for Tidal Station Ratings • Representation of changes that are related to the incoming (flood) or out-going (ebb) tides or water level changes. Area of maximum flow changes in relation to index meter. • Artificially created by time errors between instruments. • Associated with noise in measurements. More measurements may help “close” the loop. See Ruhl and Simpson (2005); SIR 2005-5004, Appendix C & D
Example “Loop” Caused by Lack of Synchronization From Ruhl and Simpson (2005); SIR 2005-5004, Appendix D
Publication of Tidal Data – Tide Affect • A Tide Cycle repeats every 24 hours and 50 minutes • For this reason, the tidal period (cycle) and the daily mean averaging period are not in sync. • (TP= 24.83 hours DM =24 hours)
Broad River Semi-Diurnal Tide Signal2 Highs and 2 Lows a Tidal day Tidal Day 24.83 hours 24 hour Day
Publication of Tidal Data • The tidal period (TP) and the daily mean (DM) averaging period are not in sync. (DM =24 hours TP= 24.83 hours) • Out of sync averaging will bias the DM. Daily mean values (DMV) may be misleading because DMV will have a cyclic behavior with an amplitude and period that differs from the original data • “Publication of 24-hour means for discharge at sites influenced significantly by tidal dynamics will no longer be allowed.” Effective WY2010
Publication of Tidal Data – Possibilities • Use a Filter to compute net daily mean flow • Minimal product: • ADR site data sheet with descriptive info • Only make the unit values available • Will this meet cooperators needs? • Will not provide information on net flow • Publishing Minimum and Maximum values • Will this meet the cooperators needs? • Will not provide information on Net Flow. • Most likely will work better as way of publishing variables such as salinity than it will for discharge
Publication of Tidal Data – Tidal Filtering • DMV (non-filtered data) may be misleading because they will have an artificial cyclic behavior with an amplitude and period that differs from that of the original data (DM based on 24 hours TP is 24.8 hours) • Filtering will help evaluate the non-tidal component of flow occurring in a tidal reach. If you are trying to get net flow for smaller time periods (daily -weekly) it will be necessary to the filter the data • With filtering you will lose data at the beginning and end of the period of record -- usually 2-5 days depending on the type of filter used
Publication of Tidal Data – Tidal Filtering • Godin low-pass filter available in ADAPS • Godin filter only for discharge record (not stage) • Other filters can be used if process and software used are documented • Discharge records must not be processed piecemeal with some periods having filtered data and others having unfiltered data. • Annual maximum flows (minimum flows, optionally) must be documented and properly qualified in the “Extremes for Current Year”
Example Showing the Effects of Three Different Filtering Algorithms
Publication of Tidal Data • If filter to get net flows: • Read references in OSW Memo 2010.08 • Seek advice from your WSC Specialist/Regional Specialist • Considerations: • Use filter in ADAPS unless there is suitable reason not to. • If you filter: • Document the filters used in Station Analysis and provide that info to anyone using the data • Store all unit values and filtered daily values in ADAPS • Use parameter codes specified in OSW Memo 2010.08, p. 11
Sources of Information • Godin, G., 1972, The analysis of tides: University of Toronto Press • Roberts, J., and T.D. Roberts, 1978, Use of the Butterworth low-pass filter for oceanographic data: Journal of Geophysical Research • Walters, R.A. and Heston, C., 1982, Removing tidal-period variations from time-series data using low-pass digital filters: Journal of Physical Oceanography • Simpson, M.R and Bland, R., Techniques for Accurate Estimation of Net Discharge in a Tidal channel • Grubbs J.W and Pittman J.R.; 1997, Applications of Acoustical Methods for Estimating Water Flow and Constituent Loads in Perdido Bay, Florida U.S. Geological Survey Water-Resources Investigations report 97-4101 • Levesque, V.A., 2004, Water Flow and Nutrient Flux from Five Estuarine Rivers along the Southwest Coast of the Everglades National Park, Florida, 1997 – 2001: US Geological Survey Scientific Investigations Report 2004-5142 • Ruhl, C.A. and Simpson, M.R., Computation of Discharge Using the Index-Velocity Method in Tidally Affected Areas: US Geological Survey Scientific Investigations Report 2005-5004