Download

1 / 19
190 likes | 291 Views
Libby Dam June 2006 Spill: Total Dissolved Gas Monitoring. Libby Dam June 2006 Spill. Introduction Corps of Engineers project Spill occurred between June 8 – June 27, 2006 Spillway discharge 1.5 to 31 kcfs Total project discharge 25.5 to 55 kcfs TDG monitoring vs. TDG exchange study

E N D
Libby Dam June 2006 Spill • Introduction • Corps of Engineers project • Spill occurred between June 8 – June 27, 2006 • Spillway discharge 1.5 to 31 kcfs • Total project discharge 25.5 to 55 kcfs • TDG monitoring vs. TDG exchange study • Limited monitoring scope
Libby Dam June 2006 Spill • Project Site • Libby Dam • Headwater project. • Straight concrete gravity gate controlled dam, 370 feet high and 2,887 feet long, located at RM 221.9 on the Kootenai River. • Built by the COE (1966-1972) for flood control. • Selective withdrawal system used to maintain downstream temperatures. • Full pool elevation 2459 ft, spillway crest 2405 ft. • Lake Koocanusa • Reservoir is approximately 90 miles long. • Provides 4.98 million acre-feet of storage. • Kootenai River
Location of Libby Dam and Lake Koocanusa in the Kootenai River Basin.
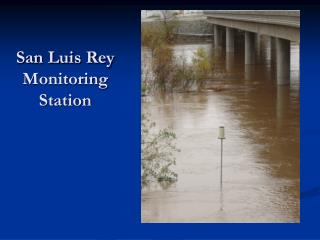
Libby Dam June 2006 Spill • Study Design • Real Time Monitoring • Station LBQM at USGS tailwater gage • Located 0.6 miles downstream on left bank to capture maximum TDG • Automated Loggers • Transect of 3 instruments at Thompson Bridge (Station TMPSN1-3), located immediately downstream of Libby Dam to measure lateral TDG distribution • One instrument located 8.5 miles downstream at a constriction in the Kootenai River (Station HAUL) represents mixed river conditions • One instrument located in back eddy of spill (Station SPW3) • Parameters • Total dissolved gas (TDG) • Temperature • Depth • Operating Conditions • Spill occurred between June 8 – June 27 • Spillway discharge 1.5 to 31 kcfs • Total discharge 25.5 to 55 kcfs
Libby Dam June 2006 Spill • Sampling Period • Real Time Station • Station LBQM operational June 8 to 27, 2006 • Automated Loggers • Station TMPSN1-3 operational June 18 to 27, 2006 • Data from June 14 to June 18 were invalid due to insufficient sampler depth • Station HAUL operational June 14 to 27, 2006 • Station SPW3 operational June 20 and 21, 2006
TMPSN SPW LBQM HAUL 1 Mile Full Time Station Part Time Station TDG Sampling Stations in the Kootenai River Near Libby Dam
SPW3 TMPSN3 TMPSN2 TMPSN1 LBQM 0.25 Mile Full Time Station Part Time Station TDG Sampling Stations in the Kootenai River Immediately Below Libby Dam
LBQM TMPSN1 TMPSN2 TMPSN3 SPW3 TDG monitoring stations at Libby Dam tailwater
Libby Dam June 2006 Spill Libby Dam discharge June 2006.
Libby Dam June 2006 Spill • Water Quality Sampling Instruments • Real Time Station • Hydrolab MiniSonde 4a TDG sensor/Common Sensing barometer • Geomation Model 2380 DCP, Solar Power • Radio transmission station • Measurements collected every hour • Logger Stations • Hydrolab DataSonde 4 and MiniSonde 4a • Automated wireless logging • Deployed on bottom of river • Measurements logged on 30-minute intervals • Calibration • COE data quality criteria • Pre and post deployment • Laboratory calibrations • Field calibrations
Libby Dam June 2006 Spill Pre and post deployment TDG calibration information
Libby Dam June 2006 Spill • Lateral and longitudinal TDG gradients were apparent in the Kootenai River at all spillway flows • Maximum TDG saturations along the left channel bank • Lowest TDG saturations associated with powerhouse flows along the right channel bank • Mixing of powerhouse flows and riverine processes caused diminishing TDG saturations downstream • Maximum TDG saturation at TMPSN1 (133%), at LBQM (131%), and at HAUL (120%)
Libby Dam June 2006 Spill • Spillway Releases Resulted in Elevated of TDG Pressures in Kootenai River • TDG saturation at station TMPSN1 and LBQM were similar during 2006 spill • Abrupt increase (107-123%) in TDG Pressure as a function of Spill 1.5-6 kcfs • Little increase (123-125%) in TDG pressure as a function of spill 6-15 kcfs • Mild Increase (124-133%) in TDG Pressure as a Function of Spill 15-31 kcfs • TDG saturation at station LBQM was at or below the Montana standard of 110% at spillway releases less than 2 kcfs • TDG saturation at station HAUL represented nearly well mixed conditions
Libby Dam June 2006 Spill Observed total dissolved gas saturation versus total spillway discharge at Libby Dam, June 2006.
Observed and calculated stilling basin total dissolved gas saturation versus total spillway discharge at Libby Dam, summer 2002. P=231.75(1-exp(-0.4436 Qsp)) TDGsat=(P+BP)/BP*100 R2=0.96 P=TDG Pressure – BP (mm Hg) Qsp=total Spillway Discharge (kcfs) BP = Barometric Pressure (mm Hg)
Relationship between observed and calculated Station HAUL total dissolved gas saturation versus total spillway discharge at Libby Dam, June 2006. Libby Dam June 2006 Spill
Libby Dam June 2006 Spill • Conclusions • Fixed monitoring station at Libby Dam (LBQM) was representative of river conditions for TDG • Strong lateral gradient in TDG saturations in the Kootenai River below Libby Dam at all spillway flows • Maximum TDG saturations observed at Thompson Bridge (133%) • Kootenai River nearly well mixed at station HAUL with a maximum TDG saturation of 120%