Download
1 / 22
220 likes | 396 Views
Converging Lenses Investigation. El Jefe Jet Li/Tony Jaa Hybrid. Purposes. Determine the effect of changing object distance on image distance. Determine the effect of changing object distance on image height.(Jack Holds) Determine the effect of changing object height on image height.

E N D
Converging Lenses Investigation El Jefe Jet Li/Tony Jaa Hybrid
Purposes • Determine the effect of changing object distance on image distance. • Determine the effect of changing object distance on image height.(Jack Holds) • Determine the effect of changing object height on image height.
Hypotheses • Image Distance will be inversely proportional to Object Distance. • Image Height will be inversely proportional to Object Distance. • Image Height will be proportional to Object Height.
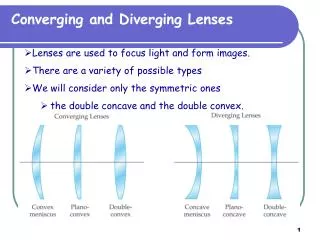
Equipment Used • Dynamics Track • Light Source and Objects of Varying Height • Metric Ruler + Premarked Measurements on Track • Converging Lens • Screen/Location for Image Formation • Distant Powerline
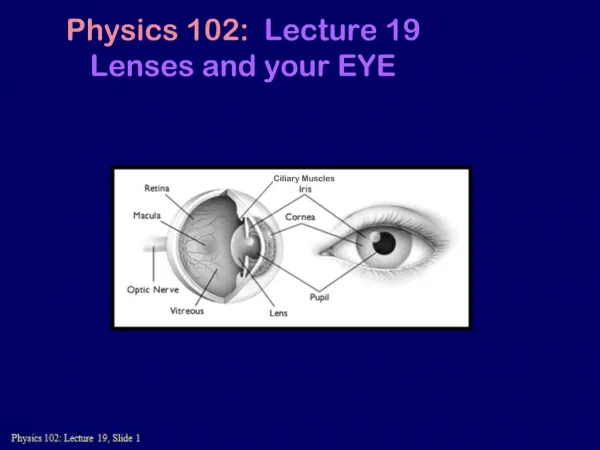
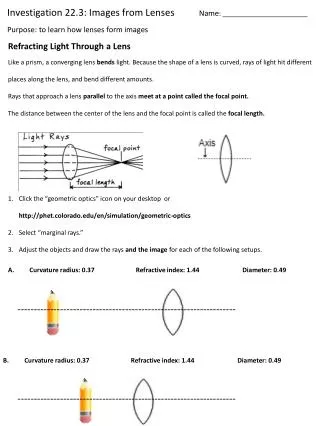
Procedure for Finding Focal Length (picture from ibm.com) • Obtain a dark room. • With a window open, locate a discernible object a long distance away. • Mount your lens on a dynamics track between the located object and a screen. • Move the screen until the most focused image of the distant object appears on the screen. • Measure the distance from your lens to the screen. This is the focal length of your lens.
Procedure for Image Distance vs Object Distance • Refer back to photo of apparatus. The distance from the lens to the object (light-source) is the object distance. The distance from the lens to the focused image on the screen is the image distance. • Begin with an object distance of 15 focal lengths. Adjust the screen until the formed image is most focused. Record the image distance. • Decrease the object distance in increments of 1 focal length until an object distance of 3 focal lengths is reached. Past this point, reduce the size of increments to 5 cm until an object distance of 2 focal lengths is reached. From here, reduce the increments to 2 cm until the object distance is less than 1 cm from the focal length. • Remember to record the image distance precisely.
Procedure for Image Height vs Object Height • This experiment is done in 2 scenarios. In one case, the object distance is 1.5f. In the next case, object distance is increased to 2.5 f. • Find the image distance in each scenario. • Vary the height of the object (you are given transparent arrows of varying size). • Record the height of the object in every case, and record the corresponding height of the image.
Mathematical Analysis for Image Distance vs Object Distance Investigation s = object distance, s’ = image distance y=mx +b 1/s’=k*(1/s)+b k = -1.001 (calc by LoggerPro) b = 5.054 1/m (calc by LoggerPro) b=1/f (f=0.202 m) Model: 1/f = 1/s’ + 1/s
Mathematical Analyses for Image Height vs Object Height Experiments hi=image height, ho=object height hi is proportional to ho hi = k*ho k = deltahi/deltaho k = 1.957 (calc by LoggerPro) hi = 1.957 ho hi=image height, ho=object height hi is proportional to ho hi = k*ho k = deltahi/deltaho k = 0.641 (calc by LoggerPro) hi = 0.641 ho
Important Guy • About the Author • The Physics Classroom tutorial pages were written by Tom Henderson, science teacher at Glenbrook South High School in Glenview, Illinois. Tom teaches physics and (during less fortunate years) chemistry. He is a graduate of the University of Illinois where he received degrees in Chemical Engineering and Chemistry. Tom has been teaching physics since 1989. • In addition to teaching students, Tom has been involved in numerous projects working with companies and education groups to develop curriculum and web-based resources. Such groups include the Electronic Learning Long Distance Network (ELDN!), Fermi Lab Education Group, American Association for the Advancement of Science (AAAS), Annenberg/Corporation of Public Broadcasting, NCS/Educational Structures, and Thinkronize/NetTrekker. Tom has played an assortment of roles for such groups, including editing a children's science novel, developing content for online exhibits, developing a grades 7-8 curriculum, producing authentic assessment projects, and finding and cataloging useful science web sites. Tom is always willing to consider such independent work. He can be contacted at thenderson@glenbrook.k12.il.us.
Where Ray Diagrams Came From (physicsclassroom.com • Credits and Thanks • The Physics Classroom began as a volunteer project during the 1996-97 school year. The first five units were completed during that time; no special funding or release time was provided for that work. During the summer of 1998, a grant was received from The First in the World Consortium of Schools in order to complete some additional lessons on the topics of waves, sound, light, reflection and refraction. Thanks to the generosity and support of the Consortium, an additional five units were added to The Physics Classroom during the summer of 1998. Funds for the production of units on the topics of static and current electricity are presently being sought. • Many of the graphics used in these lessons were originally part of the "Hewitt DrewIt" clip art collection available through LaserPoint Educational Software (424 Quartz Street, Redwood City, CA 94062; Fax: 650-369-1220). The graphics were subsequently imported into a graphics program, edited, colorized, resized, and used in these Web documents. They are used with the permission of the original artist - Paul Hewitt. • The Physics Classroom Project is supported by NSF-DUE 0840768.