Download
1 / 2
20 likes | 144 Views
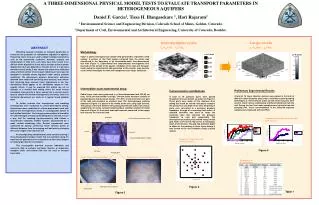
A THREE-DIMENSIONAL PHYSICAL MODEL TESTS TO EVALUATE TRANSPORT PARAMETERS IN HETEROGENEOUS AQUIFERS Daniel F. Garcia 1 , Tissa H. Illangasekare 1 , Hari Rajaram 2 1 Environmental Science and Engineering Division, Colorado School of Mines, Golden, Colorado.

E N D
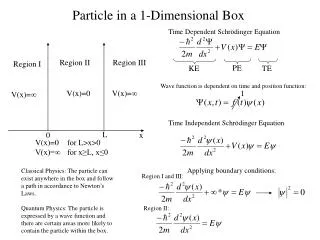
A THREE-DIMENSIONAL PHYSICAL MODEL TESTS TO EVALUATE TRANSPORT PARAMETERS IN HETEROGENEOUS AQUIFERS Daniel F. Garcia1, Tissa H. Illangasekare 1, Hari Rajaram2 1 Environmental Science and Engineering Division, Colorado School of Mines, Golden, Colorado. 2 Department of Civil, Environmental and Architectural Engineering, University of Colorado, Boulder. Ln K (m/d) Ln K (m/d) 6.94 5.92 4.71 3.46 2.47 Metal Grid 3D heterogeneous packing location Screen Plywood Constant Head Boundary Condition PVC sheet Pumping Well Arial view during packing Arial view of the final packing Metal grid located at layer 28 Crane system Figure 3 Large-scale Lx=Ly=80 Lz=80v Intermediate-scale Lx=Ly=10 Lz=15v ABSTRACT Obtaining accurate estimates of transport parameters is crucial for the prediction of contaminant migration in aquifers. Frequently, tracer tests are used to obtain transport parameters such as the dispersivity coefficient. However, analysis and interpretation of data from such tests have been found to be difficult as the dispersivity is not only a function of tracer plume displacement but also depends on the type of test. In a previous two-dimensional study, it was shown that dispersivity estimated using a limited number of convergent radial tracer tests was not adequate to simulate plume migration under natural gradient conditions. The discrepancy between dispersivity estimates obtained from radial flow (involving small sources) and uniform flow (involving large sources) tracer experiments in our two-dimensional study appear to be attributable largely to non-ergodic effects. It may be expected that effects are not so dramatic in a realistic field setting where the small vertical correlation scale permits a tracer source that is several meters deep to sample the medium heterogeneity effectively, even if its horizontal dimensions are small as in typical forced gradient tests. To further evaluate this, experimental and modeling investigations were conducted in a three-dimensional setting. Experiments were conducted in a three-dimensional sand tank packed with heterogeneous media, in a configuration similar to well-studied field sites. The heterogeneous medium is formed by five different types of silica sands distributed in the tank in such a way that the resulting log-transmissivity field follows a second-order stationary random function characterized by a small vertical anisotropy ratio. Several experiments were conducted by placing continuous tracer injection points at different distances from the pumping well and also by changing the screen length of the injection well. An accompanying computational study conducted using a three-dimensional transport model that was validated using the experimental data focused on simulations of flow and transport in media larger than the test domain. This investigation provided accurate laboratory and numerical data to evaluate stochastic theories of subsurface transport under non-uniform flow that are used to interpret tracer data. Methodology Figure 2 shows heterogeneous random field generated to represent a field system. A portion of this field system extracted from the center was reproduced in the laboratory in an intermediate-scale three-dimensional test tank (Figure 1). Experimental and computational investigations first focused on this portion of the aquifer. Validation of the flow and transport model using the experimental data generated at this smaller scale permits us to further investigate the flow and transport at much larger field scale. Figure 1 Figure 2 Intermediate-scale experimental setup Preliminary Experimental Results Instrumentation and Methods Radial tracer tests were performed in a three-dimensional tank 243.84 cm long, 121.92 cm wide and 63.5 cm high. The tank frame structure consists of plywood panels and aluminum beams. Thin PVC sheets lined the inner part of the tank and provided an excellent seal. The heterogeneous packing depicted in Figure 1 is placed in the middle of the tank using rigid screens. The portion of the tank between the packing and the tank walls was used as supply tanks to create constant head boundary condition needed for radial flow tests (Figure 3). A constant head spill reservoir connected to the supply tank ensures the constant head. A total of 14 tracer injection devices were placed in the tank at different radial distances away from a centrally located pumping well (Figure 3). These devices (point as well as line sources) were used to inject tracers continuously at different distances from the well. During the test 3-ml. water samples were collected from the pumping well. Tracer concentrations in the collected aqueous samples were measured with the HPLC. A total of 24 pressure ports were placed throughout the test domain as shown on Figure 4. These ports were made of thin stainless steel tubing that could be moved vertically to measure the pressure at any depth in the tank. All pressure ports were connected to a precision pressure transducer through of a scanning fluid switch. A solenoid controller was used to rotate the scanning valve that connects the pressure transducer to each port sequentially. The heterogeneous packing was created using a metal grid made of tin sheets that forms a rectangular mesh of 2020 cells. The grid had sufficient depth to allow for the packing of three layers before it was moved to the next elevation using a pulley system. Comparison between point and line source Layout of injection and pressure ports Figure 5 Summary of Experiments Figure 4 Table 1
Time=100 min. Q P_4 P_3 P_2 P_5 S_3 P_1 P_6 S_8 S_6 Time=150 min. S_2 S_1 S_7 S_5 S_4 t= 150 min t= 50 min Q t= 1 min A THREE-DIMENSIONAL PHYSICAL MODEL TESTS TO EVALUATE TRANSPORT PARAMETERS IN HETEROGENEOUS AQUIFERS Daniel F. Garcia1, Tissa H. Illangasekare 1, Hari Rajaram2 1 Environmental Science and Engineering Division, Colorado School of Mines, Golden, Colorado. 2 Department of Civil, Environmental and Architectural Engineering, University of Colorado, Boulder. 3-D View of the Evolution of the Plume Validation of Flow Model Transport Simulations SUMMARY We conducted a series of intermediate-scale flow and tracer experiments in a three-dimensional test tank to generate a comprehensive data set to validate upscaling theories and modeling tools. Preliminary results indicate that the flow and transport simulators correctly represent the physical phenomena. It is shown from experimental and numerical radial tracer tests as well as from snapshots of the solute plume associated with injections at the same distance from the pumping well that a three-dimensional aquifer may inherit large degree of variability in transport parameter estimates. It is postulated a less dramatic effect compare to the previous two-dimensional studies. Further, we illustrate the effect that the use of different screen length of the injection well may cause on the transport estimate. Head values simulated using the experimentally determined hydraulic conductivities of the sand matched well with the observed heads. The most reliable measurements result in simulated pumping rates with less than 5 % of relative error. The Random Walk technique was found very convenient in this case where radial mixing induced by pumping from a full penetrating well had to be simulated. The transport code provides different velocity interpolation algorithms and is designed to simulate radial flow tracer tests with pulse and step inputs. The pulse response function was generated using the numerical model. The response to continuous tracer injection was computed through discrete convolution of the pulse response. This scheme was computationally efficient as it did not require the use of the numerical model to simulate continuous injection of particles into the system. The velocity field is obtained from a seven-point finite difference groundwater model, MODFLOW96. In Figure 7 we present the simulation of experiment # 2. Figure 7a shows snapshots of the evolution of the solute plume whereas Figure 7b illustrates the model match to the experimental breakthrough curve. We see that the mathematical model can greatly reproduce the physical behavior. Figure 7b FUTURE RESEARCH TASKS Validate numerical modeling tools (flow and transport simulators and inverse models) that will be used in data analysis. Quantify the scale dependence of dispersivities estimated from radial tracer tests using curve-fitting techniques as well as the variability of these estimates in three-dimensional aquifers. Use the understanding gained from laboratory and computational investigations to develop a systematic approach for characterizing field sites based on radial flow tests. Determine how many tracer tests and over what scale will lead to reliable estimates of transport parameters. Compare intermediate-scale and large-scale experimental and simulation results with existing theories. Specifically, study of the Scale dependence of effective hydraulic conductivity in radial flow. Experimentally and computationally quantify discrepancy between dispersivities estimated from uniform and forced-gradient tracer tests in a realistic three-dimensional aquifer. Quantify effect of the source type in three-dimensional aquifers. Figure 7a Figure 6 Top View of Snapshot of the Plumes Side View of Snapshot of the Plumes Figure 8a Figure 9a Table 2 Preliminary Computational Investigations In Figure 8 and 9 we show some preliminary intermediate-scale computational results in dispersive radial flow in three-dimensional aquifers to illustrate the effects that variations in hydraulic conductivity may originate in the behavior of solute migration. Specifically, figures 8a and 9a show snapshots of the evolution of the solute plume associated to injections located at the same distance from the pumping well. Figures 8b and 9b present the breakthrough curves obtained at the pumping well resulting from these injections. As previously shown in two-dimensions [Chao et al, 2000], it is observed large variations in the arrival time of peak concentrations as well as in the spread of the breakthrough curve. This may lead to large uncertainty in transport parameters estimates obtained from single tracer tests. Quantification of this effect in a three dimensional setting will be done in future work. Within this context, the third dimension is expected to lead to a less dramatic effect compares to the previous two-dimensional studies. Injection points REFERENCES Chao, H.,-C., Rajaram, H., Illangasekare, T., 2000. Intermediate-scale experiments and numerical simulations of transport under radial flow in a two-dimensional heterogeneous porous medium. Water Res. Res., Vol. 36 (10), 2869-2884. Figure 8b Figure 9b