Download
1 / 33
330 likes | 356 Views
Atmospheric Chemistry Experiment (ACE): Recent Results. Peter Bernath (and ACE team) Department of Chemistry, University of York Heslington, York, UK and Department of Chemistry, University of Waterloo, Waterloo, ON, Canada. ACE Satellite. See http://www.ace.uwaterloo.ca.

E N D
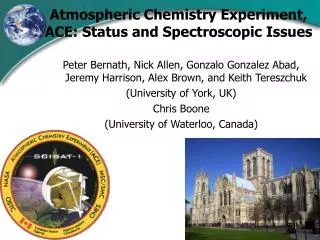
Atmospheric Chemistry Experiment (ACE): Recent Results • Peter Bernath (and ACE team) • Department of Chemistry, University of York • Heslington, York, UK • and • Department of Chemistry, University of Waterloo, Waterloo, ON, Canada
ACE Satellite See http://www.ace.uwaterloo.ca
Solar Occultation Advantages: Radiance of sun gives higher S/N than emission Limb view gives longer path length ~500 km (lower detection limits) than nadir “Self-calibrating” so excellent long-term accuracy and precision Disadvantages: Modest global coverage Samples only free troposphere
Timeline • Jan. 1998 Proposal to CSA • Feb. 2001 FTS and Imager CDR • Mar. 2001 MAESTRO CDR • Jun. 2001 Bus CDR • Sept. 2002 S/C integration & test • Mar. 2003 Instrument test (Toronto) • May 2003 Final integration (DFL) • Aug. 2003 Launch • Sept. 2003 Commissioning • Feb. 2004 Routine operations • Mar. 2004 Arctic campaign • Feb. 2005 Arctic campaign • Feb. 2006 Arctic campaign • Feb. 2007 Arctic campaign • Feb. 2008 Arctic campaign First ACE data Feb. 2004, mission currently approved to March 2010. Mission had a 2-year lifetime – fifth anniversary Aug. 2008.
Instruments • Infrared Fourier Transform Spectrometer operating between 2 and 13 microns with a resolution of 0.02 cm-1 • 2-channel visible/near infrared Imagers, operating at0.525 and 1.02 microns (cf., SAGE II) • Suntracker keeps the instruments pointed at the sun’s radiometric center. • UV / Visible spectrometer (MAESTRO) 0.4 to 1.03 microns, resolution ~1-2 nm • Startracker Bernath et al. GRL, 32, L15S01 (2005)
MAESTRO MAESTRO PI: T. McElroy, MSC Dual concave grating spectrograph, 1-2 nm resolution
FTS – Decontamination Results After 6 months operation After decontamination Ryan Hughes
ACE-FTS Species Measured • Baseline species (version 2.2): H2O, O3, N2O, CO, CH4, NO, NO2, HNO3, HF, HCl, N2O5, ClONO2, CCl2F2, CCl3F, as well as pressure and temperature from CO2 lines • Other routine species: COF2, CHF2Cl, CF4, CH3Cl, C2H6, SF6, OCS, HCN • Research species: CCl4, HOCl, H2O2, HO2NO2, CCl2FCClF2, CH3CClF2, ClO, C2H2, C2H6, COFCl, COCl2, CH3OH, HCOOH, H2CO, N2 and additional isotopologues
CO2 line near 61 km Typical ACE-FTS fitting results Note: results are plotted on the raw measurement grid Boone et al. Appl. Opt. 44, 7218 (2005)
Temperature Retrievals-CO2 90 km Schwartz et al. JGR, 113, D15S11 (2008) 15 km
Northern Midlatitudes Southern Midlatitudes Stratospheric Chlorine Budget Nassar et al. WMO Ozone Report 2006 JGR, 111, D22312 (2006) Current HALOE value 3.3 ppb CFC-11, CFC-12 , HCFC-22, CCl4, CH3Cl, CF4, CFC-113, HCFC-142b, HFC134a, F2CO, ClFCO, Cl2CO
Asian Monsoon Anticyclone Park et al., ACP, 8, 757 (2008)
O װ C Cl Cl Global Distribution of Phosgene, Cl2CO Fu et al. GRL, 34, L17815 (2007) (Toon et al.’s calculated linelist for ν5near 850 cm-1)
Carbonyl chlorofluoride is a product of chlorofluorocarbon (CFC-11 mainly) decomposition Previously studied by aircraft (5 - 12 km) First global picture obtained from ACE-FTS Spectroscopy based on Brown’s ATMOS linelist created from Kitt Peak spectra, with rough intensities. Distribution of COClF D. Fu et al., to be submitted
Effect of Lightning (HNO3) Lightning produces NO, which is oxidized to HNO3. Need to have 6 Tg N/yr from lightning to match ACE observations of tropospheric HNO3 (Martin et al. JGR, 112, D09309 (2007))
ACE Solar Spectrum CH, NH, OH OH CO Δv=2 CO, Δv=1 ACE solar spectrum (F. Hase): 224782 spectra added, improvement over ATMOS, no telluric lines, but 0.02 cm-1 vs 0.01 cm-1 resolution (resolution largely determined by width of solar lines) and 750-4400 cm-1 vs 600-4800 cm-1.
ATMOS Spacelab-3, 1985 New atomic and molecular assignments (ACE linelist) by L. Wallace (NOAO); improved spectroscopic data for CH, NH and OH. For OH, Reg Colin (ULB) finds v=4 can be improved. ATMOS ATLAS-3, 1994 ACE, 2008
Biomass Burning in Brazil MODIS Fire Counts 26 Sept. 2004 27 Sept. 2004 28 Sept. 2004
CH3OH contribution to the spectrum Dufour et al. ACP, 6, 3463 (2006); data from Xu et al. 2004
ACE is an upper tropospheric “air quality” mission measuring global CH4, CH3OH, HCN, C2H2, C2H6, H2O2, HCOOH, H2CO, plus likely PAN and acetone. Global Methanol Dufour et al. ACP, 7, 6119, 2007 LDMz-INCA model (D. Hauglustaine)
Young Biomass Burning Plume Coheur et al. ACP, 7, 547, 2007
Coheur et al. (Brussels), PAN from a biomass plume near East Africa PAN, Peroxyacetyl nitrate, etc.
Missing lines Error with multiplets HCHO spectroscopy: new linelist Use of HCHO line intensities calculated by A. Perrin Dufour et al.
HCHO contribution to the spectrum 6 spectral windows selected in the range 2735 - 2830 cm-1: 2739.85 ; 2765.65 ; 2778.4 ; 2781.2 ; 2812.25 ; 2826.67
Preliminary comparisons with CTMs Comparison with 2 state-of-the-art models (LMDz-INCA and GEOS-Chem) that use different emissions inventories. North Hemisphere: seasonality of UT HCHO well reproduced intensity of the maximum not always reproduced South Hemisphere: LMDz-INCA systematically smaller South Tropics: small impact of biomass burning larger variability in the models
ACE Partners (Selected) • Canada- K. Walker, J. Drummond, K. Strong, J. McConnell, W. Evans, T. McElroy, I. Folkins, R. Martin, J. Sloan, T. Shepherd, etc. • USA- NASA launched ACE: C. Rinsland, L. Thomason (NASA-Langley), C. Randall (U. Colorado), B. Bojkov (NASA-Goddard), M. Santee, L. Froidevaux, G. Manney (JPL), etc. • Belgium- supplied CMOS imager chips: R. Colin, P.-F. Coheur, M. Carleer (ULB), D. Fussen, M. DeMaziere (IASB), M. Mahieu, R. Zander (Liege), etc. • UK- J. Remedios (Leicester), P. Palmer (Edinburgh), M. Chipperfield (Leeds) • France- C. Camy-Peyret, C. Clerbaux, C. Brogniez, G. Dufour, D. Hauglustaine (Paris) • Japan- M. Suzuki, Y. Kasai (JAXA) • Sweden- G. Witt (Stockholm)