Download
1 / 9
90 likes | 94 Views
A look at the unusual trends in US retail sales during Q3 2017, including the impact of Hurricanes Harvey and Irma, followed by a rebound in September. Strategies for maximizing holiday shopping and engaging with shoppers through advertising and new media approaches.

E N D
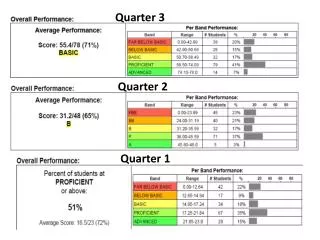
A Questionable Quarter • Q3 2017 was a somewhat unusual period for US retail sales, as July had the largest increase during the past 7 months, at +0.6%; however, Hurricane Harvey during August was a major disruptor of retail sales, which declined 0.2%. • Then, September had the largest increase in retail sales during the past 2½ years, increasing 1.6%, while July’s reading was revised to a decline of 0.1%. • September’s increase could be considered an anomaly, as much of the increase has been attributed to spending related to Hurricane Harvey and Irma, including the purchase of replacement vehicles and increased spending at building supply stores.
Happy Shoppers and Small Business Owners • According to Gallup’s weekly US Economic Confidence Index, July started poorly, with consumers rating the economy at 0; however, it then began to improve to +7 for the first week of August (July 31–Aug. 6). • During mid-August, the index increased to its highest number since mid-March, reaching +11; however, the weekly average for September decreased to +4, from August’s average of +6, as half of Americans said the economy was worsening. • According to the Wells Fargo/Gallup Small Business Index, Q3’s +106 was the highest during the past 10 years, an increase of 11 points from Q2 2017.
A Better, Negative Performance • RetailNext’s Retail Performance Pulse for July 2017 somewhat matched with the significant increase in overall retail sales, as its data found that traffic declined 5.5%, the lowest during the past 18 months and sales decreased 5.3%. • Although sales decreased 5.3% YOY, it was still the best performance during the past 12 months and better than the average of -9.0 for the first six months of 2017. • The first and last weeks of July were the high points of the month, with Friday, the 28th, the best conversion and shopper yield days and Saturday, the 29th, the best sales, traffic and transaction day.
August: The Dog Days of Retail • The August Retail Performance Pulse reflected retail’s struggles during the month, as brick-and-mortar sales decreased 9.5% and traffic 7.7%. Hurricane Harvey as well as a back-to-shopping season that now stretches into September may have contributed. • ATV (Average Transaction Value) didn’t decline as much as it did during July, -2.1% and -2.4%, respectively, but transactions decreased almost twice compared to July, at -7.5% and -3.8%, respectively. • Net Sales, ATV and Transactions were all in negative territory for all 4 weeks of August. Sales’ performance was -7.7%, -7.4%, -8.3% and -12.7%, while transactions worsened as the month progressed: -4.2%, -4.8%, -8.1% and -11.5%.
A September Rebound • Exclude auto dealers’ 3.6% and gas stations’ 5.8% increases for September and the total retail sales increase was just +0.4%. September’s Retail Performance Pulse for brick-and-mortar stores supports that trend with a 7.5% decline in sales. • Conversions improved significantly from August’s +0.3% to +0.9%, and Shopper Yield was +1.0%, compared to August’s -2.0%. • Weekly performances were all in negative numbers, except ATV, which increased 0.5% during week #5, but Net Sales decreased in a range of 4.7% to 9.8% and Transaction, -3.6% to -7.8%.
Advertising Strategies • maximize traffic and engage with shoppers. Host holiday decorating and cooking seminars; spas offer special holiday stress-reducing sessions; and similar attractions/promotions. • Use holiday shopping to boost 2018 purchases. Offer shoppers who make a qualifying purchase by 12/24/17, a discount/coupon for Valentine’s Day, Mother’ Day, Father’s Day, etc. • Gen Zers and Millennials like to browse in-store more than older generations and their most popular reason for doing so is fulfilling an immediate need, so have sales associate ask them what they need most and help make the purchase process easy.
New Media Strategies • Assign an employee to be the “Christmas E-Elf,” creating and uploading social media posts of his or her photo dressed as a Christmas elf with photos of holiday gift choices in a daily gift-list catalog. • Record and post a quarterly, “behind-the-scene” video of an employee brainstorming session to create ideas to improve the store: better displays, new merchandise, special offers, etc. • Promote a January “Customer for a Day” event on social media with photos and videos. Someone will be the store’s guest: a spa treatment during the morning, a free lunch, an afternoon of specially priced shopping and his or her photo prominently displayed in-store.