Download

1 / 50
600 likes | 1.11k Views
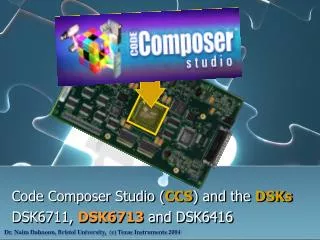
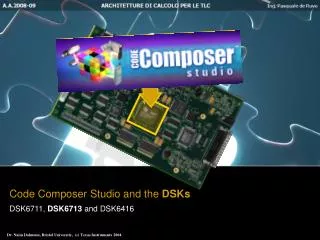
Code Composer Studio V4. Agenda. Introduction of CCS4 Starting a new project. Overview. CCS 4 is the integrated development environment (IDE) for TI’s Digital Signal Processors (DSP), microcontrollers and application processors. Source code editor Project environment Compiler Debugger

E N D
Agenda Introduction of CCS4 Starting a new project
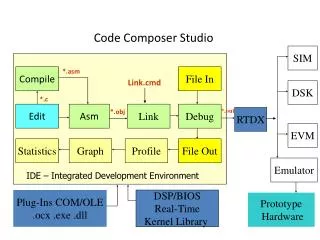
Overview CCS 4 is the integrated development environment (IDE) for TI’s Digital Signal Processors (DSP), microcontrollers and application processors. Source code editor Project environment Compiler Debugger Software (simulator) Hardware (emulator) Graph windows Image visualization Profiler Scripting capability Flash programmer
IDE: C/C++ Perspective Perspective bar Project view Text editor Outline view Build view Problems view Fast view bar
IDE: Debug Perspective Register view / watch view / etc Debug view Source code editor Memory view Graph window
Agenda Introduction of CCS4 Starting a new project Compiling a project
Starting a project • Select the workspace • Defines the location of your project • Automatically saved on close • Contains: • Project settings • Macros • Views on close • Other custom settings specific for YOUR personal computer • Cannot be zipped and forwarded to others • Can be changed later on
New Project Wizard New projects are created by using the “New Project Wizard:
New Project Wizard This will allow to select: The project type Processor used: e.g. C6000, C2000, etc… The configurations Default are Debug Release Referenced projects (if any) The used C/C++ indexer Full Fast None Output type A default linker command file Various project settings Device variant Code Generation tools version Runtime Support Library Target content etc
Adding Files There are two ways to add files to the project: Create a new source file Drop existing source files in the project directory All files in the directory of a project are automatically added to the project. Take care that you are not adding unwanted content!
C Language Symbols Files are automatically parsed and variables, declaration and definitions displayed. These can be accessed from the outline view or from the project view
Importing an Existing Project Accessed from You can import a single project or multiple projects in one step:This will also give you theopportunity to copy theprojects into your workspace
Importing a CCS 3.3 Project The CCS 3.3 import wizard is called from: This will help you to import the existing project, but manual re-work might still be required Change or add path names for library functions Change of .cdb files Note: CCS 3.1 and CCS 2.x projects cannot be imported automatically. They need to be converted to a CCS 3.3 project first (using CCS 3.3)
Agenda Introduction of CCS4 Starting a new project Building a project
Compile Flow You can either write standard assembly directly, or it can be created by the compiler. Object files, created by the assembler, are linked together to create the executable output file of the processor. The map file is an output report of the linker. The .out file can be loaded into your system by the debugger portion of CCS.
Build Configurations By default, CCS includes two sets of build options: Debug Release Users can create any number of additional build configurations. Users can modify the settings of any pre-defined build option
Build Options Build options are controlled by the “Properties” dialog of the project:
Linker: Basic Options Note: The stack size field is empty by default, causing a linker warning during build (but the default size of 0x400 will be used). Also, the default linker command file does not include the stack settings, so you need to set it here!
Finally, the Actual Build There are a couple of ways to build the project: Use the menu bar: Use the drop-down menu: Use the keyboard –shortcuts CTRL+SHIFT+P or ALT+SHIFT+P
Build: The Differences Build Active Project Builds only the active project Compiles only new or changed files (incremental build) Rebuild Active Project Builds only the active project Compiles all files, independently of their state Build All Builds all projects in the workspace Rebuild All Rebuilds all projects in the workspace Build Project The same as “Build Active Project” Build Working Set Build a pre-defined set of projects Clean Cleans a defined set of projects Build Automatically Builds automatically once a changed file is saved
Build: One Last Way Clicking will build the active project, switch to the debug perspective and load the executable. This will work only if a valid target configuration is loaded. If CCS is already in the debug perspective, the project will be recompiled and the executable loaded.
Debugging a Project Once all source files are added to the project and all project settings are made, the project can be debugged. But, before we can do that, a target description (aka a target configuration is needed)
Debugging a Program Run (F8) / Run Low Power / Free Run Halt program Terminate debug session. This will switch back to the C/C++ perspective (CTRL+ALT+T) Step into (F5) Step over (F6) Assembly step into Assembly step over Step return (F7) Reset CPU (ALT+R) / Reset Emulator Restart (ALT+F8)
IDE: Debug Perspective Register view / watch view / etc Debug view Source code editor Memory view Graph window
Breakpoints Breakpoints can be set in two ways: Double clicking in the grey bar at the left side of the file view Right-clicking on the line where the breakpoint should be located and selecting “New Breakpoint” Breakpoints can be viewed and manipulated (and if needed added) in the “Breakpoint View” Breakpoints can be: Software Hardware Profile related (pause, resume, terminate)
Disassembly View Opened by selecting“View Disassembly Shows: Address Opcode Disassembly Can be customized Can be shown Always Only if no C-source code is available Can also be used to set breakpoints
Watch Views Local variables are displayed automatically Other watch expressions can be added easily Expressions can be a global or a local variable or logical / arithmetic expressions using them (or use it as a quick calculator) Additional watch views can be added and the display can be customized Variables can also be watched in Q format
Memory View This view can be opened by“View Memory” Displays the contents of the memory at a certain address If variables are used to set the address the ‘&’ operator needs to be used unless the variable is an array. Memory contents can be displayed in several ways: Floating point Integer Hexadecimal (TI and C style) Binary Character 8/16/32/40/64 bit The memory view also allows to save, load and fill memory Several memory views can be open simultaneously
Register View Opened from “View Registers” One window will display all the register sets Multiple register windows can be opened at any time Registers can be manipulated from this view Two different views are available: Tree (default) Grid (with a selectable number of grids) Registers can be copied individually or as complete set
Graph View • Can be accessed fromTools Graph • Time-Domain • Single / Dual • FFT: • Magnitude / Magnitude Phase • Complex • Waterfall • Different update modes: • Manual • Refresh on halt • Continuous refresh • Display can be customized • Line style • Grid • etc. • If in continuous refresh mode, the update interval can be set in the local menu of the Watch View • Data can be exported
Image Analyzer • Can be accessed fromTools Image Analyzer • Image Format • RGB • Bayer • YUV • Bitonal
Debugging Options Under “Tools Debugger Generic Options other stuff can be configured as well: Behavior of breakpoints if another program is loaded Autorun: Where the program should run to after a load or a reset Different launch options: Connect to target, restore breakpoints from previous session (can be dangerous!) etc Display of processes etc Interrupt handling during assembly debugging.
Static System Concepts What is a static system? • All components remain during the life of a system (no create/delete) • No “heap” or use of C’s malloc()/free() functions • Opposite is a “dynamic” system Benefits • Reduced code size – no create/delete or heap mgmt (just declarations) • Reduced MIPS for environment creation • Deterministic – malloc() is non-deterministic • Optimal when most resources are required concurrently Limitations • Fixed allocation of memory usage (cannot create new components at runtime) Bottom Line • Pick static or dynamic based on system requirements – both are supported by BIOS
Sections • Every C program consists of different parts called Sections • All default section names begin with "." Global Vars (.bss) Init Vals (.cinit) short m = 10; short x = 2; short b = 5; main() { short y = 0; y = m * x; y = y + b; printf("y=%d",y); } Local Vars(.stack) Code(.text) Let’s review thelist of compilersections… Std C I/O(.cio)
Placing Sections In Memory 128K IRAM 1180_0000 .text .bss .far .cinit .cio .stack 4MB FLASH 6400_0000 512MB DDR2 C000_0000 • How do you define the memory areas(e.g. IRAM, FLASH, DDR2) ? • How do you place the sections intothese memory areas ?
H/W Memory Description • Name, location, length • Ex: IRAM, origin = …, len = … • S/W Sections • Name, memory area to link to • Ex: .far → IRAM Linking Linker.cmd .obj .out Linker .map
-l rts6400.lib -stack 0x800 -heap 0x800 MEMORY { IRAM: origin = 0x11800000, len = 0x40000 FLASH: origin = 0x64000000, len = 0x400000 DDR: origin = 0xC0000000, len = 0x8000000 } SECTIONS { .bss {} > IRAM .far {} > IRAM .text {} > DDR .cinit {} > FLASH } LIBRARIES STACK/HEAP SIZES MEMORY AREAS CODE/DATA SECTIONS Linker Command File
user.c #pragma DATA_SECTION(x, “.far:mysect”); int x[1024]; #pragma CODE_SECTION(fir, “.text:myfir”); void myfir (short * Src, short * Dst, short len) { user.cmd SECTIONS { .far:mysect :> IRAM .text:myfir :> FAST_RAM } User Defined Sections • Users can place their code/data in default C Sections(e.g. .text, .far, .bss) or … • Create User-Defined sections to link critical code/data tospecific memory locations (vs. being lumped in with .far, e.g.)