Download
1 / 11
120 likes | 133 Views
Reading Topographic Maps. Topography. The lay of the land. Shows relief using contour lines. Relief- highs and lows of Earth’s surface. Relief can be calculated Take the difference between the highest point and the lowest. Ex: Mountain peak 20 m. lake 10m 20m- 10m= 10m

E N D
Topography • The lay of the land. • Shows relief using contour lines. • Relief- highs and lows of Earth’s surface. • Relief can be calculated • Take the difference between the highest point and the lowest. • Ex: Mountain peak 20 m. lake 10m • 20m- 10m= 10m • The relief of this area is 10m
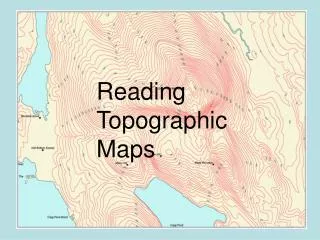
Contour Lines • Lines on topographic maps. • Connect points of equal elevation. • Everything connected to that line has the same elevation. • Elevation- the distance something is above sea level. Sea level= 0m or 0ft.
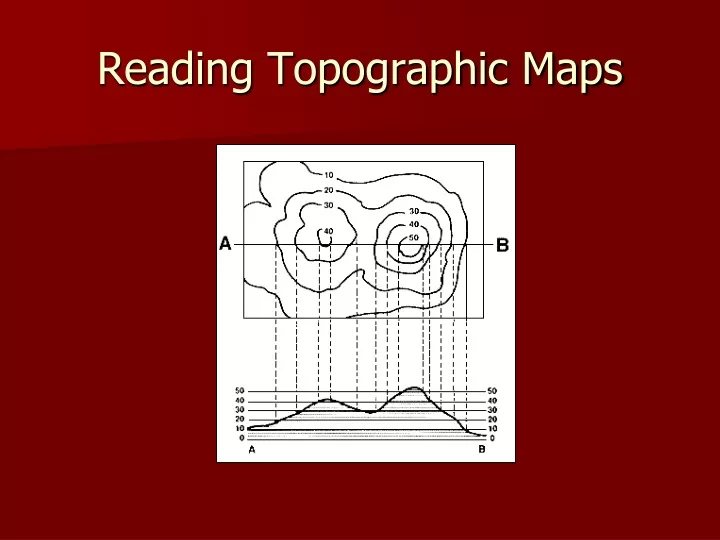
Contour Intervals • Contour interval- gives the difference in elevation between 2 contour lines. • Another indicator of height. How it will look on a map C.I.= 1000ft
Index Contours • Index contours occur every fifth contour line; accentuated in thickness . • Help the map user read elevations on a map. Red arrows indicate location of index contours.
Streams • Streams are shown as a blue line on maps. • When contour lines cross a stream it looks like an upside down V. • The point in the V points upstream. It opens in the direction the water is flowing.
Depression Contours • Depression contours show areas of lower elevation. • Drawn like contour lines with marks on the inside.
Hills • Hills are represented on a topographic map by a series of concentric contour lines in a rough circle
Slope • Closely spaced contour lines represent steep slopes. • Widely spaced contour lines represent gentle slopes.
Colors on a topographic map- • Blue = water • Green = forest • Brown = contour lines • Black = cultural features (buildings, place names, boundary lines, roads, etc.) • Red = principal roads • Pink = urban areas • Purple = revisions to an older map, compiled from aerial photos. If an area has become urbanized, this may be shown as purple shading on the new, revised map.
This powerpoint was kindly donated to www.worldofteaching.com http://www.worldofteaching.com is home to over a thousand powerpoints submitted by teachers. This is a completely free site and requires no registration. Please visit and I hope it will help in your teaching.