Download
1 / 12
120 likes | 237 Views
This tool allows analysts to summarize quantitative data in a sorted format, observe scattergrams, and create frequency histograms with equal class widths. Input your data, set class parameters, and visualize data distributions through various plots.

E N D
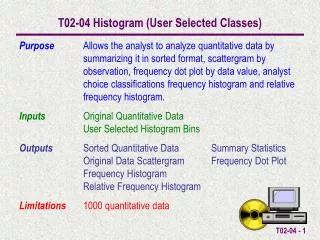
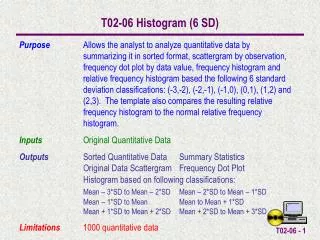
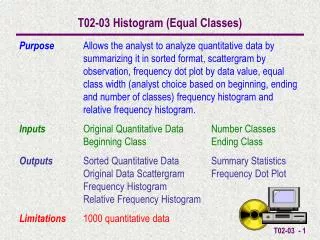
T02-03 Histogram (Equal Classes) PurposeAllows the analyst to analyze quantitative data by summarizing it in sorted format, scattergram by observation, frequency dot plot by data value, equal class width (analyst choice based on beginning, ending and number of classes) frequency histogram and relative frequency histogram. Inputs Original Quantitative Data Number Classes Beginning Class Ending Class Outputs Sorted Quantitative Data Summary Statistics Original Data Scattergram Frequency Dot Plot Frequency Histogram Relative Frequency Histogram Limitations 1000 quantitative data
An Example An accounting firm has collected a sample of audit times from last year. To get a better feel for the distribution of the audit times the manager wants to look at a Histogram of the data using 5 equal width classifications.
Data can either be entered directly into the OriginalData cells or copy/paste special/values into the cells.
Once the data is entered SummaryStatistics (Count, Max, Min & Range) are automatically calculated. The SortMacro can be run to sort the OriginalData into the SortedData cells. This also automatically calculates the necessary information for the DotPlot.
The Summary Statistics (Max & Min) can be used to establish the BeginClassPoint and the EndClassPoint. These are then entered with the NumberClasses for the Histogram.
The HistogramMacro can be run to automatically calculate the Histogram Information. The EqualClassWidth and HistogramBin Classifications are automatically calculated.
Decimal Point Accuracy can be set for the Relative Frequency The Histogram Information (frequency & relative frequency) is displayed in tabular format by the classifications.
WorksheetTabs can be selected to view the Original Data Scattergram, Frequency Dot Plot, Frequency Histogram and Relative Frequency Histogram.
The Scattergram displays a plot of the observations in the sequence they were entered.
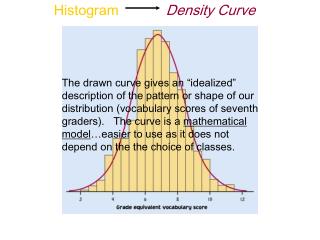
The Equal Width Frequency Histogram shows the histogram for the number of equal width classes chosen. The legend should be read bottom-up.
The Equal Width Relative Frequency Histogram shows the histogram for the number of equal width classes chosen. The legend should be read bottom-up.