Download
1 / 10
130 likes | 854 Views
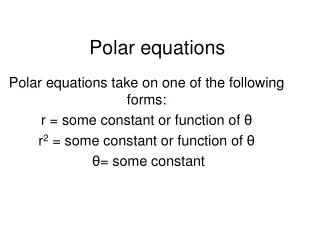
Precalculus. Lesson 6.5. Graphs of Polar Equations. Quick Review. No. No. Yes. What you’ll learn about. Polar Curves and Parametric Curves Symmetry Analyzing Polar Curves Rose Curves Limaçon Curves Other Polar Curves … and why

E N D
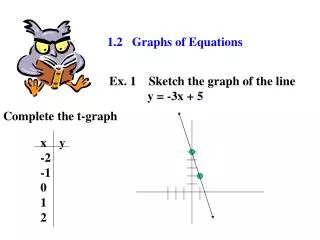
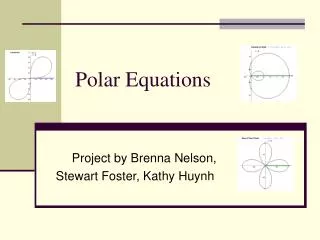
Precalculus Lesson 6.5 Graphs of Polar Equations
Quick Review No No Yes
What you’ll learn about • Polar Curves and Parametric Curves • Symmetry • Analyzing Polar Curves • Rose Curves • Limaçon Curves • Other Polar Curves … and why Graphs that have circular or cylindrical symmetry often have simple polar equations, which is very useful in calculus.
Symmetry The three types of symmetry figures to be considered will have are: • 1. The x-axis (polar axis) as a line of symmetry. • 2. The y-axis (the line θ = π/2) as a line of symmetry. • 3. The origin (the pole) as a point of symmetry. Reference page 541 in text.
Symmetry Tests for Polar Graphs The graph of a polar equation has the indicated symmetry if either replacement produces an equivalent polar equation. To Test for SymmetryReplaceBy • about the x-axis (r,θ) (r,-θ) or (-r, π-θ) • about the y-axis (r,θ) (-r,-θ) or (r, π-θ) • about the origin (r,θ) (-r,θ) or (r, π+θ) Reference page 541 in text.
Example Testing for Symmetry Replace (r, ) by ( – r, – ). Commutative property of mult. Trig. identity Divide by – 1
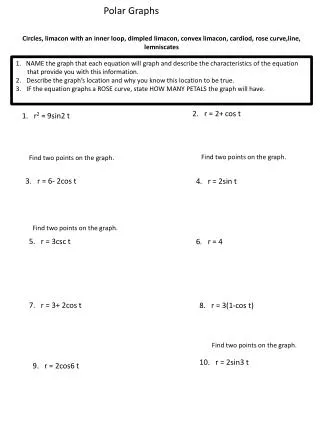
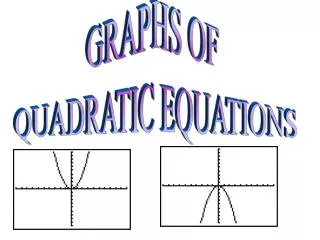
Rose Curves What might an equation be for the curve shown here?
Example Testing for Symmetry Replace (r, ) by ( r, – ). Trig. identity Because the equations of r = 6 – 5cos(− ) and r = 6 – 5cos are equivalent, there is symmetry about the x-axis. The max. r-values occur at 11 since the range is [1, 11]. The sinusoidal axis is at 6 and the amplitude is 5.
Homework: Text pg548/549 Exercises #2-54 by 4’s