Download
1 / 75
750 likes | 848 Views
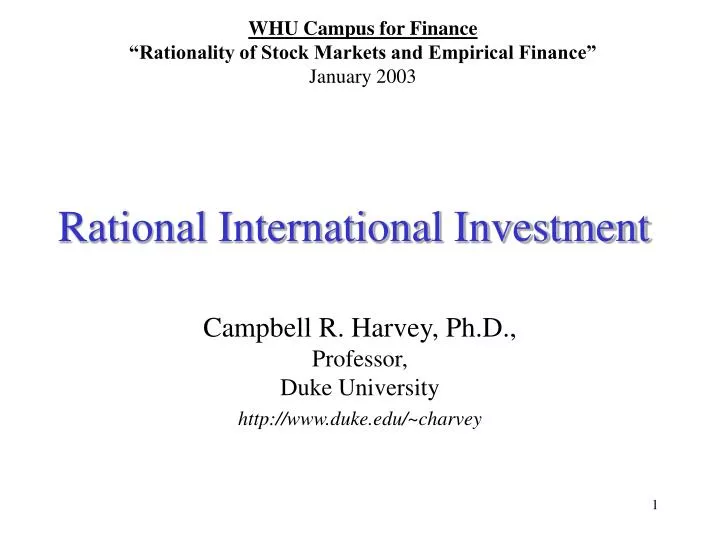
WHU Campus for Finance “Rationality of Stock Markets and Empirical Finance” January 2003. Rational International Investment. Campbell R. Harvey, Ph.D., Professor, Duke University http://www.duke.edu/~charvey. The Plan. Returns, diversification and predictability

E N D
WHU Campus for Finance “Rationality of Stock Markets and Empirical Finance” January 2003 Rational International Investment Campbell R. Harvey, Ph.D., Professor, Duke University http://www.duke.edu/~charvey
The Plan • Returns, diversification and predictability • Long horizon vs. short horizon • Expected performance • Prospect theory or skewness preference? • Importance of GPRs • The stock markets play a role in the world economy
The International Track Record International Performance Wilshire Mid Cap Thirty Year Treasury STRIP Twenty Year Treasury STRIP Wilshire Large Cap Wilshire 5000 Ten Year Treasury STRIP EAFE X-Japan Wilshire Small Cap Seven Year Treasury STRIP Credit MBS Five Year Treasury STRIP Aggregate Government EAFE Germany Three Year Treasury STRIP Two Year STRIP One Year Treasury STRIP Source: Erb and Harvey (2002)
Returns and Diversification Data from MSCI
Returns and Diversification Data from IFC
Returns and Diversification Data from MSCI
Returns and Diversification Data from MSCI
Returns and Diversification Data from MSCI
Returns and Diversification Data from MSCI
Returns and Diversification Data from IFC
US Business Cycle is Predictable US Yield Curve Inverts Before Last Six US Recessions(5-year US Treasury bond - 3-month US Treasury bill) Annual GDP growth or Yield Curve % Real annual GDP growth Yield curve Recession Correct Recession Correct Yield curve accurate in recent forecast Recession Correct 2 Recessions Correct Data though 1/12/03
Returns and Diversification Data from IFC and MSCI
Returns and Diversification Acrobat Document Source: Goetzmann, Li and Rouwenhorst (2002)
Returns and Diversification Acrobat Document Source: Goetzmann, Li and Rouwenhorst (2002)
The Long Horizon Data from Dimson, Marsh and Stauton (2002)
The Long Horizon Data from Dimson, Marsh and Stauton (2002)
The Long Horizon Data from Dimson, Marsh and Stauton (2002)
The Long Horizon Data from Dimson, Marsh and Stauton (2002)
What to Expect Data from Dimson, Marsh and Stauton (2002)
What to Expect Data from MSCI. Japan divided by 10.
What to Expect (1920 - August 2002) 35 30 1996 - 2001 25 20 Current environment: Inflation: 2.3% P/E: 24.7x January 2003 15 . 10 5 0 - 10.0% - 5.0% 0.0% 5.0% 10.0% 15.0% 20.0% 5 yr Average CPI Price to Trailing Peak Earnings vs 5 Year Average CPI (overlapping annual data) Price to Trailing Peak Earnings Source: Bloomberg, Standard & Poor’s Source: Goldman Sachs (2002)
What to Expect • Ten-year risk premium around 3.5% and stable whereas one-year risk premium quite variable 10-year premium 1-year premium Source: Graham and Harvey (2003)
What to Expect U.S. Equity and Bond Returns are Positively Correlated Source: Erb and Harvey (2002)
What to Expect World Real Equity and Real Bond Returns are Positively Correlated Source: Erb and Harvey (2002)
What to Expect Inflation Negatively Related to Real US Bill Returns Source: Erb and Harvey (2002)
What to Expect Inflation Negatively Related to Real US Intermediate Bond Returns Source: Erb and Harvey (2002)
What to Expect Inflation Negatively Related to Real US Bond Returns Source: Erb and Harvey (2002)
What to Expect Inflation Negatively Related to Real US Equity Returns Source: Erb and Harvey (2002)
What to Expect Inflation Negatively Related to Real International Bill Returns Source: Erb and Harvey (2002)
What to Expect Inflation Negatively Related to Real International Bill Returns Source: Erb and Harvey (2002)
What to Expect Inflation Negatively Related to Real International Equity Returns Source: Erb and Harvey (2002)
What to Expect Inflation Negatively Related to Real International Equity Returns Source: Erb and Harvey (2002)
Rethinking Risk • Traditional models maximize expected returns for some level of volatility • Is volatility a complete measure of risk?
Rethinking Risk • Much interest in prospect theory, downside risk, asymmetric volatility, semi-variance, extreme value analysis, regime-switching, jump processes, ...
Rethinking Risk • In prospect theory (Kahneman and Tversky) • Investor risk averse in the case of gains, as a small certain gain is preferred to a probable risky gain • Investor risk seeking in the case of losses, as a probable risky loss is preferred to a small certain loss • So investors do not evaluate outcomes based on true probabilities
Rethinking Risk • Loss aversion is a special case • Investor has a greater incremental utility penalty for losses than for an equally large gain • Overall, investor looks risk averse
Rethinking Risk • But, perhaps we can think of these situations in terms of preference for higher moments • Most asset allocation work operates in two dimensions: mean and variance -- but skew is important for investors. • Examples:
Rethinking Risk 1. The $1 lottery ticket. The expected value is $0.45 (hence a -55%) expected return. • Why is price so high? • Lottery delivers positive skew, people like positive skew and are willing to pay a premium
Rethinking Risk 2. High implied vol in out of the money OEX put options. • Why is price so high? • Option limits downside (reduces negative skew). • Investors are willing to pay a premium for assets that reduce negative skew • Is this loss aversion or skewness preference?
Rethinking Risk 3. Some stocks that trade with seemingly “too high” P/E multiples • Why is price so high? • Enormous upside potential (some of which is not well understood) • Investors are willing to pay a premium for assets that produce positive skew • [Note: Expected returns could be small or negative!]
Rethinking Risk Source: Harvey and Siddique (2000)
Rethinking Risk Data from MSCI
Rethinking Risk Data from IFC
Rethinking Risk Data from MSCI
Rethinking Risk Data from IFC
Alternative Vehicles Alternate Asset Classes Often Involve Implicit or Explicit Options Source: Agarwal and Naik (2002)
Alternative Vehicles Alternate Asset Classes Often Involve Implicit or Explicit Options Source: Agarwal and Naik (2002)
Alternative Vehicles Alternate Asset Classes Often Involve Implicit or Explicit Options Source: Agarwal and Naik (2002)
Alternative Vehicles Alternate Asset Classes Often Involve Implicit or Explicit Options Source: Agarwal and Naik (2002)
Alternative Vehicles Alternate Asset Classes Often Involve Implicit or Explicit Options Source: Figure 5 from Mitchell & Pulvino (2000)