Download
1 / 40
700 likes | 1.38k Views
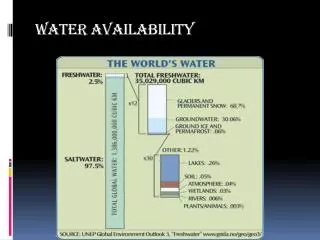
Water Availability. Water Resources Planning and Management Daene C. McKinney. Only this portion is renewable. Global Water Resources. saline (salt) water: 10 to 100g/L (34g/L) brackish water: 1 to 10g/L (treatable) Fresh water: <1g/L (drinkable).

E N D
Water Availability Water Resources Planning and Management Daene C. McKinney
Only this portion is renewable Global Water Resources saline (salt) water: 10 to 100g/L (34g/L) brackish water: 1 to 10g/L (treatable) Fresh water: <1g/L (drinkable)
Principal sources of fresh water for human activities (44,800 km3/yr) Global Water Cycle
The Importance of Water • Human / Environmental Health • Dignity / Gender Equity • Economic Growth / Poverty Reduction • Environment and Ecosystem Services • Food Security / Crops and Fisheries • Energy Generation / Flood Control • Conflict Prevention and Mitigation Summary of the World Water Crisis and USG Investments in the Water Sector, USAID, 2010
Population and Water Use global freshwater use is ~4000 km3/year ~10% of the renewable supply (44,800km3/year)
Water Cycle Diagram Global Water Security – an engineering perspective The Royal Academy of Engineering, 2010
Global Water Withdrawals World Water Assessment Programme. 2009. The United Nations World Water Development Report 3: Water in a Changing World. Paris: UNESCO, and London: Earthscan
Water Use by Sector World Water Assessment Programme. 2009. The United Nations World Water Development Report 3: Water in a Changing World. Paris: UNESCO, and London: Earthscan
Water Supply and Sanitation • Supply (2002) • 1.1 billion people lacked access to improved water sources (17% of global population) • Nearly two thirds live in Asia (733 million people) • 42% of Sub-Saharan Africa is without improved water • Sanitation (2002) • 2.6 billion people lacked access to improved sanitation (42% of global population) • Over half of those live in China + India (~ 1.5 billion people) • 64% of Sub-Saharan Africawithout sanitation coverage • 69% of rural dwellers in developing countries without access to improved sanitation (27% for urban dwellers)
Access to Safe Water 2009: 800 million people lacked access to an “improved” water sources. Summary of the World Water Crisis and USG Investments in the Water Sector, USAID, 2010
Access to Sanitation 2009: more than 2 billion people lacked access to basic sanitation facilities Summary of the World Water Crisis and USG Investments in the Water Sector, USAID, 2010
Water Supply and Sanitation • Diarrhea (2004) • 1.8 million people die every year from diarrheal diseases (including cholera) • 90% are children under 5 in developing countries • 88% of diarrheal disease is attributed to unsafe water supply, inadequate sanitation and hygiene • Improved access to water supply and sanitation can reduce diarrhea morbidity by more than 1 million per year http://www.who.int/water_sanitation_health/diseases/burden/en/index.html
Diarrhea is the Second Leading Cause of Death in Children Worldwide 2008: Nearly 1.8 million children under the age of 5 died from diarrhea. This can be reduced by 30-40%. Summary of the World Water Crisis and USG Investments in the Water Sector, USAID, 2010
Poverty and Development • Two thirds of the 884 million people (2009) without access to safe drinking water live on less than $2 per day. • The urban poor population is large and growing rapidly. Half of urban residents live in slums where the no formal access to water or sanitation is typical. • > 1 billion people live in extreme poverty (< $1 a day) http://www.unmillenniumproject.org/resources/fastfacts_e.htm http://stats.oecd.org/qwids
Poverty in Sub-Saharan Africa World Water Assessment Programme. 2009. The United Nations World Water Development Report 3: Water in a Changing World. Paris: UNESCO, and London: Earthscan
Water, Sanitation & Poverty World Water Assessment Programme. 2009. The United Nations World Water Development Report 3: Water in a Changing World. Paris: UNESCO, and London: Earthscan
Domestic Water Use • Survival = 5 L/day • Drinking, cooking, bathing, and sanitation = 50 L • United States = 250 to 300 L • Netherlands = 104 L • Somalia = 9 L * L/c/d = liters per person per day
Water Stress Index • Based on human consumption • linked to population growth • Domestic requirement: • About 100 L/c/d = 40 m3/c/yr • Associated agricultural, industrial & energy need: • About 20 x 40 m3/c/yr = 800 m3/c/yr • Total need: • 840 m3/c/yr • About 1000 m3/c/yr
Water Stress Index • Water availability below 1,000 m3/c/yr • chronic water related problems impeding development and harming human health • Water sufficiency: >1700 m3/c/yr • Water stress: <1700 m3/c/yr • Water scarcity: <1000 m3/c/yr
Water Scarcity (2008) In 2008, over 1.54 billion people suffered from water stress Summary of the World Water Crisis and USG Investments in the Water Sector, USAID, 2010
Water Scarcity (2030) By 2030, 3.3 billion people will live “water stress” conditions Summary of the World Water Crisis and USG Investments in the Water Sector, USAID, 2010
Water Availability - USA • USA • Area 9.36 mln km2 • Population 304mln, 2008 From: Shiklomanov http://espejo.unesco.org.uy/]
Water Availability - USA http://pubs.usgs.gov/circ/2004/circ1268/pdf/circular1268.pdf
Water Use - USA http://pubs.usgs.gov/circ/2004/circ1268/index.html
Trends http://pubs.usgs.gov/circ/2004/circ1268/index.html
Trends http://pubs.usgs.gov/circ/2004/circ1268/index.html
Texas Regional Water Planning • State Water Plan provides for development, management, and conservation of water resources and preparation for and response to drought conditions, in order that sufficient water will be available at a reasonable cost to ensure public health, safety, and welfare; further economic development; and protect the agricultural and natural resources of the entire state • Steps: • Describe the regional water planning area. • Quantify current and projected population and water demand • Evaluate and quantify current water supplies • Identify surpluses and needs • Evaluate water management strategies and prepare plans to meet the needs • Recommend regulatory, administrative, and legislative changes; and • Adopt the plan, including the required level of public participation. http://www.twdb.state.tx.us/publications/reports/State_Water_Plan/2007/2007StateWaterPlan/2007StateWaterPlan.htm
Texas Water Demand http://www.twdb.state.tx.us/wrpi/swp/swp.htm
Capital Cost ($ billion) Total = $173 Billion
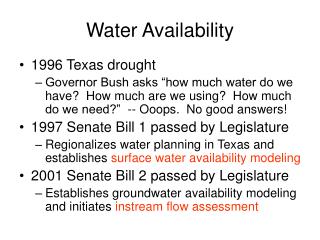
Texas Senate Bill 1 (1997) • SB-1 Directed TCEQ to develop Water Availability Models (WAM) • Water Availability Models • Determine how much water is available to meet existing or permit new water rights • Assess availability and reliability (volume and time) based on simulating river management and water allocation using historic, naturalized flows, prior appropriation water rights, and institutional policies of water allocation and reservoir storage • Provide consistent set of planning tools and data sets for water planning in all 23 Tx basins • Regional planning and processing of new water permits • Simulation model: WRAP, data sets developed in ArcHydro http://www.tceq.state.tx.us/permitting/water_supply/water_rights/wam.html
Texas Water Use Permits • Any change in water use requires new assessment • 22 River Basins - Permits approved if • Unappropriated water is available, • A beneficial use is established • Water conservation will be practiced • Existing water rights are not impaired, and • Water use is not detrimental to public welfare. • 23rd Basin - Rio Grande • Over appropriated for many years • No new rights for additional water use being granted • Rights are commonly transferred between users
WRAP Model • Simulate any of the 23 Texas basins • Compute ability to meet water demands under potential scenarios • Inputs: • Flows, demands, parameters, losses, infrastructure, operating rules, control points • Control Points: • Reservoirs, diversions, return flows, hydropower plants, environmental flow points, other system control locations • Compute at each control point: • Naturalized flow - No basin development • Regulated flow - Full water rights • Unappropriated flow - Available for new permit • Scenarios • Authorized use: Full water rights demanded, no return flows, used to approve new permit applications • Current use: Actual historic water use demended, return flows included, used to determine cancellation of permits for non-use