Download
1 / 50
540 likes | 698 Views
Data Transformation. Data conversion Changing the original form of the data to a new format More appropriate data analysis New variables. Data Transformation. Summative Score = VAR1 + VAR2 + VAR 3. Descriptive Analysis.

E N D
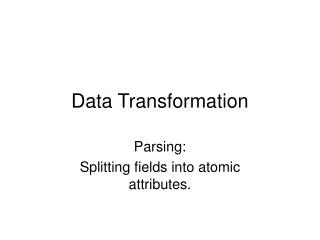
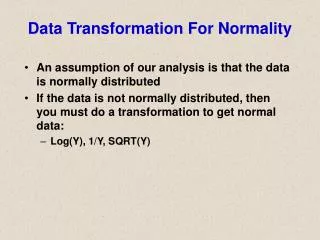
Data Transformation • Data conversion • Changing the original form of the data to a new format • More appropriate data analysis • New variables
Data Transformation Summative Score = VAR1 + VAR2 + VAR 3
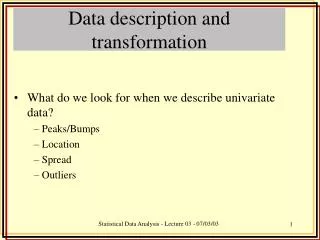
Descriptive Analysis • The transformation of raw data into a form that will make them easy to understand and interpret; rearranging, ordering, and manipulating data to generate descriptive information
Tabulation • Tabulation - Orderly arrangement of data in a table or other summary format • Frequency table • Percentages
Frequency Table • The arrangement of statistical data in a row-and-column format that exhibits the count of responses or observations for each category assigned to a variable
Central Tendency Measure of Central Measure of Type of Scale Tendency Dispersion Nominal Mode None Ordinal Median Percentile Interval or ratio Mean Standard deviation
Base • The number of respondents or observations (in a row or column) used as a basis for computing percentages
Index Numbers • Score or observation recalibrated to indicate how it relates to a base number • CPI - Consumer Price Index
Measures of Central Tendency • Mean - arithmetic average • µ, Population; , sample • Median - midpoint of the distribution • Mode - the value that occurs most often
Measures of Dispersion or Spread • Range • Mean absolute deviation • Variance • Standard deviation
The Range as a Measure of Spread • The range is the distance between the smallest and the largest value in the set. • Range = largest value – smallest value
Deviation Scores • The differences between each observation value and the mean:
Low Dispersion Verses High Dispersion 5 4 3 2 1 Low Dispersion Frequency 150 160 170 180 190 200 210 Value on Variable
Low Dispersion Verses High Dispersion 5 4 3 2 1 High dispersion Frequency 150 160 170 180 190 200 210 Value on Variable
Variance • The variance is given in squared units • The standard deviation is the square root of variance:
The Normal Distribution • Normal curve • Bell shaped • Almost all of its values are within plus or minus 3 standard deviations • I.Q. is an example
Normal Distribution 13.59% 13.59% 34.13% 34.13% 2.14% 2.14%
Normal Curve: IQ Example 70 145 85 115 100
Standardized Normal Distribution • Symetrical about its mean • Mean identifies highest point • Infinite number of cases - a continuous distribution • Area under curve has a probability density = 1.0 • Mean of zero, standard deviation of 1
Standard Normal Curve • The curve is bell-shaped or symmetrical • About 68% of the observations will fall within 1 standard deviation of the mean • About 95% of the observations will fall within approximately 2 (1.96) standard deviations of the mean • Almost all of the observations will fall within 3 standard deviations of the mean
A Standardized Normal Curve z 1 2 -2 -1 0
Standardized Values • Used to compare an individual value to the population mean in units of the standard deviation
Linear Transformation of Any Normal Variable into a Standardized Normal Variable s s m X m Sometimes the scale is stretched Sometimes the scale is shrunk -2 -1 0 1 2