Download
1 / 20
200 likes | 384 Views
Lesson 6:. basic plots. Lesson 6 Outline: Plot 1-basic plot commands 1) Figure Line style Marker style Labels and Titles Axes Matlab help LineSpec (colors, marker styles, line styles) 2) Matlab program for basic plots L6_plots.m

E N D
Lesson 6: basic plots
Lesson 6 Outline: Plot 1-basic plot commands 1) Figure Line style Marker style Labels and Titles Axes Matlab help LineSpec (colors, marker styles, line styles) 2) Matlab program for basic plotsL6_plots.m line plots: 1D with time Multiple data sets 1D across time scatter plots: 2D bar plots : Hx 3)Subplots 4) Managing plots visible off pause saveas 5)Play with zoom
x=rand(20,10); figure plot(x(:,10)) plot(x(:,9)) hold on plot(x(:,10),’r’)
figure plot(x(:,5),'--b','LineWidth',2) hold on plot(x(:,4),':ko','LineWidth',2) close all plot(x(:,3),'-md','LineWidth’ 2, 'MarkerEdgeColor’, 'k', 'MarkerFaceColor', 'g', 'MarkerSize', 10)
MatLab help search LineSpec colors line styles marker styles 5 minutes to play
axis([xmin xmax ymin ymax]) axis([1 25 -1 1]) xlabel(‘time') ylabel(’column_5') title(’random x plot')
L6_plots.m open the m file from your current directory run the program Uncomment the next plot command highlight lines 35-45 right click and “uncomment” save
Let’s look at the code plot(x,'b') hold on plot(y,'r') hold on What are we plotting? Is it a line? What color? Are there markers? Run the program and see if you were correct.
Uncomment the next plot command highlight lines 48-54 right click and “uncomment” save
Let’s look at the code plot(x,y,'b*'); What are we plotting? Is it a line? What color? Are there markers? Run the program and see if you were correct.
Uncomment the next plot command highlight lines 58-61 right click and “uncomment” save
Let’s look at the code hist(z) What are we plotting? Is it a line? What color? Are there markers? In command window type help hist Run the program and see how it looks.
What is the default bin size? Try changing the bin size hist(z,25) hist(z,50)
Uncomment the next plot command highlight lines 65-72 right click and “uncomment” save
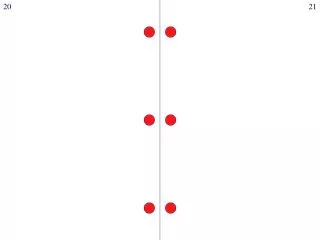
Let’s look at the code subplot(3,2,1);plot(x,’r’); subplot(3,2,2);plot(y,’b’); subplot(3,2,3);plot(x2,’-rd’); subplot(3,2,4);plot(y2,’:mo’); subplot(3,2,5);plot(x3,’- -k’); subplot(3,2,6);plot(y3, ‘-.g’); What are we plotting? Is it a line? What color? Are there markers? Run the program and see if you were correct.
subplot(3,2,1); subplot(3,2,2); subplot(3,2,3); subplot(3,2,4); subplot(3,2,5); subplot(3,2,6); 3 rows 2 columns 6 plots
Managing figures How many figures were made when you ran the program? where are they? “pause” stops the program put a pause after each figure (copy and paste line 76) Save run the program
What if you do not want to see the figures? How can you save them to a file? fig_x=figure; creating a figure “handle” set(fig_x,’visible’,’off’)’; copy and paste line 75 adjust figure “handle” for this line % pause be sure to comment out the pauses saveas(fig_x,[outpath,’xy_scatter.tif’]); copy and paste line 77 adjust figure “handle” and name of file
Using zoom on Matlab plots Click on zoom at top of figure + Select area you want enlarged Save as