Download
1 / 14
140 likes | 265 Views
Hyperbolas and Circles. Learning Targets. To recognize and describe the characteristics of a hyperbola and circle. To relate the transformations, reflections and translations of a hyperbola and circle to an equation or graph. Hyperbola.

E N D
Learning Targets • To recognize and describe the characteristics of a hyperbola and circle. • To relate the transformations, reflections and translations of a hyperbola and circle to an equation or graph
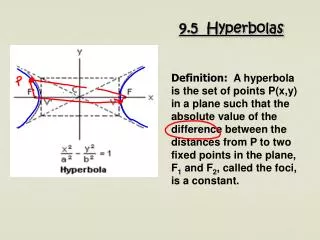
Hyperbola A hyperbola is also known as a rational function and is expressed as INSERT EQUATION GRAPH
Hyperbola Characteristics Graph • The characteristics of a hyperbola are: • Has no vertical or horizontal symmetry • There are both horizontal and vertical asymptotes • The domain and range is limited
Locator Point Graph The locator point for this function is where the horizontal and vertical asymptotes intersect. Therefore we use the origin, (0,0).
Impacts of h and k Graph Based on the graph at the right what inputs/outputs can our function never have? This point is known as the hyperbolas ‘hole’
Impacts of h and k Graph The coordinates of this hole are actually the values we cannot have in our domain and range. Domain: all real numbers for x other than h Range: all real numbers for y other than k
Impacts of h and k Graph This also means that our asymptotes can be identified as: Vertical Asymptote: x=h Horizontal Asymptote: y=k
Impacts of a Our stretch/compression factor will once again change the shape of our function. The multiple of the factor will will determine how close our graph is to the ‘hole’ The larger the a value, the further away our graph will be. The smaller the a value , the closer our graph will be. Graph
Example #3 Graph