Download
1 / 60
600 likes | 723 Views
Integrated Supply Chain Analysis and Decision Support (I98-S01). RESEARCH TEAM. Textiles and Apparel Mgmt. Industrial Engineering Industrial Engineering Textiles and Apparel Mgmt. Industrial Engineering Industrial Engineering. INVESTIGATORS : G. Berkstresser S. Fang R. King T. Little

E N D
Integrated Supply Chain Analysis and Decision Support(I98-S01)
RESEARCH TEAM Textiles and Apparel Mgmt. Industrial Engineering Industrial Engineering Textiles and Apparel Mgmt. Industrial Engineering Industrial Engineering INVESTIGATORS: G. Berkstresser S. Fang R. King T. Little H. Nuttle J. Wilson
RESEARCH TEAM STUDENTS: S-H. Chen Y. Liao A. Medaglia Ph.D. Operations Research Ph.D. Industrial Engineering Ph.D. Operations Research
Background • Supply chains involve the activity and interaction of many entities. • Successful operation requires coordination of decision making among the entities. • Decisions must be made in settings involving vagueness and uncertainty. • Performance evaluation is complicated by the presence of conflicting objectives. • These issues become more serious as the number of operations and number of players in the chain increase.
Background (cont.) • Performance measures, such as service level and cost, and system parameters, such as inventory levels, plant capacities, and leadtimes, are understood in a general sort of way. • Precise relationships between system parameters and performance measures are really not known and, in fact, will change from one time to another depending on uncertain factors such as customer demand and manufacturing yields.
Background (cont.) • Fuzzy mathematics permits one to directly model imprecise relationships using linguistic variables. • While fuzzy logic permits one to do approximate reasoning to obtain useful results.
Objectives Attack Critical Soft Goods Supply Chain integration and decision support problems using Fuzzy Mathematics and Neural Network technologies: • Develop the capability to model soft goods supply chaindesign and decision making problems using this framework. • Develop mathematical models for specific scenarios involving both numerical and linguistic data. • Design and evaluate approaches for solving the models. • Prototype a decision support system.
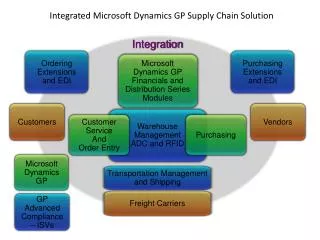
Multi-Customer Due-Date Bargainer Multi-Customer Due-Date Bargainer (MCDDB) is a new tool for due-date negotiation between a manufacturer and customers Combines the Order Management, Resource Management, Due-Date Bargaining and Schedule Management Function into one package. MCDDB
Steps of MCDDB • Step I: Input order data. • Step II: Calculate the Manufacturer’s prefer Due-Date (no overtime). • Step III: Calculate the Fuzzy Promised Due-Date balancing overtime use and delayed delivery. • Step IV: Execute bargaining process with dissatisfied customers.
Membership Functions Fuzzy Customer Due-Date 1 x 0 Fuzzy Available Resource 1 x 0 1
Master Production Schedule Source: MCDDB (Beta Version)
Resource Utilization Source: MCDDB (Beta Version)
Supply Chain Modeling and Optimization Using Soft Computing Based Simulation
Introduction • Supply chains involve the activity and interaction of many entities. • Decision makers typically have imprecise goals. • e.g. “High service level” • Some system parameters may also be imprecise. • e.g. “Production capacity” • Discrete event simulation can help design and analyze supply chains. • Many configurations and courses of action need to be investigated. • Even experts have to spend a considerable amount of time searching for good alternatives. • Soft computing guided simulationspeeds up the process.
Scheme Knowledge Extraction Supply Chain Configuration Input - Performance Data Simulation Goals met? Yes Stop No Fuzzy System / Relationship Identification Activate Fuzzy Rules/Logic Soft Computing Guided Simulation SCBS (Alpha Version)
Knits Retailer 1 Distribution Center 1 Distribution Center 2 Retailer 2 Wovens Source: SCBS (Alpha Version)
Knits Retailer 1 Distribution Center 1 Distribution Center 2 Retailer 2 Wovens
Linguistic Terms • Factory • Production rate (low, medium, high) • Finished inventory (small, medium, large) • Utilization (low, medium, high) • Distribution Center • Inventory level (small, medium, large) • Demand Point / Retailer • Demand rate (low, medium, high) • Service level (low, medium, high) • Changes in inventory limits • Large drop, Small drop, No change, Small increase, Large increase • Changes in production rates • Large reduction, Small reduction, No reduction, Small increase, Large increase
Knits Retailer 1 Distribution Center 1 Distribution Center 2 Retailer 2 Wovens Source: SCBS (Alpha Version)
Rule base to guide supply chain reconfiguration • Example rule 1: If Inventory level in the Distribution Center 1 is High and Inventory level in the Factory (Wovens) is Medium then Change in production rate in the Factory (Wovens) is Small Reduction. • Example rule 2: If Service level in Retailer 1 is Low and Inventory level in the Distribution Center 1 is Low then Change in production rate in the Factory (Knits) is Large Increase.
Goals • The degree of fulfillment of the goals can be evaluated. e.g. • Goal 1: High Service Level in Retailer 1. • Goal 2: Low Inventory Level in Retailer 2. • Goal 3: Medium Inventory Level in Factory (Knits). Each goal is met to a certain degree. • A complicated a multi-criteria objective can be specified using AND, OR, NOT operators, • e.g. • High S.L. in Retailer 1 and Low Inventory Level in Retailer 2 and not Low Throughput in Retailer 1 and Low Finished Inventory in Factory (Knits).
In the previous scheme Knowledge Supply Chain Extraction Configuration Input - Performance Simulation Data Yes Goals met? Stop No Fuzzy Activate Fuzzy System / Relationship Rules/Logic Identification Soft Computing Guided Simulation Source: SCBS (Alpha Version)
Methodologies for System Identification Conventional Mathematics Fuzzy Systems Neural Networks
Flow Chart Baseline design Subtractive clustering =>number of clusters =>number of rules FCM clustering algorithm =>input space partition =>membership functions in the IF parts Fine tuning Recursive least-squares estimation method to solve the linear least-squares estimation problem for the parameters of the first order polynomial functions in the Then parts Steepest descent method to solve the nonlinear optimization problem for the parametersof the membership functions in the IF parts
Neural Networks • Idea • to approximate the relationship between input and output data pairs. • Steps: • train the neural network with existing data. • predict performance using trained neural network.
Network Architecture Hidden Layer Input Layer Output Layer Inputs Outputs w11 v11 x1 w21 y1 v21 x2 y2 • • • • • • • • • ym xn wjn vmj
Test Case DOCK 40 60 y=100 10 10 10 0 x=100 10 Truck-Backup Problem
Decision Surface Modeling(Retail Model & Sourcing Simulator) • Objective is to provide an interactive system that captures the essential features of the retail model in multidimensional, mathematical relationships between performance measures, • e.g., service level, and key parameters, e.g., reorder leadtimes. • Provide retailer with a rapid, easy-to-use, visual tool to help understand and predict the impact on system performance of “what-if”scenarios such as: • What are the consequences of reducing initial season inventory? • What are the consequences of poor forecast? • What are the cost/benefits of reducing reorder lead times?
Neural Network Architecture • A neural network consists of several layers of computational units called neurons and a set of data-connections which join neurons in one layer to those in another. • The network takes inputs and produces outputs through the work of trained neurons. • Neurons usually calculate their outputs as a sigmoid, or signal activation functionof their inputs, • Using some known results, i.e., input-output pairs for the system being modeled, a weightis assigned to each connection to determine how an activation that travels along it influences the receiving neuron. • The process of repeatedly exposing the network to known results for proper weight assignment is called “training”.
Learning Curve Source: Sourcing Simulator (Version 2.0)
Offshore vs QR Sourcing Service Level Performance Source: Sourcing Simulator (Version 2.0)
Early Peak vs Late Peak Demand Gross Margin Performance 4] 4] Source: Sourcing Simulator (Version 2.0)
Service Level -- Adjusted Gross MarginTradeoff Adjusted Gross Margin Service Level Source: Sourcing Simulator (Version 2.0)
Confidence Intervals for Estimated Decision Surfaces • A new approach based on jackknifing promises to yield reliable, realistic confidence and prediction bands on the estimated response surface. • With k replications (runs) of n training patterns (design points), we combine k+1 response surface estimates to obtain both point and confidence interval estimates of the average response E[Y(x)] at each selected combination x = [x1, x2, ..., xm] of the m decision variables. • On the jth replication of all training patterns, common random numbers are used to sharpen the estimation of the ANN weights; but as usual, different replications are mutually independent.
New Jackknife Procedure • Let Y(x) denote an ANN estimate of the average simulation response at design point x when all k replications of the simulation are included in the training data. • Let Y-j(x) denote the ANN estimate of the average simulation response when the jth replication of each training pattern is deleted.
New Jackknife Procedure • The jth pseudovalue is Zj=kY(x) – (k–1)Y-j(x); and from the sample mean Z and the sample standard deviation SZ of the pseudovalues, we compute the 100(1–)% confidence interval for the expected response at design point x: Z t1-/2; k-1 SZ /k.