Download
1 / 6
60 likes | 132 Views
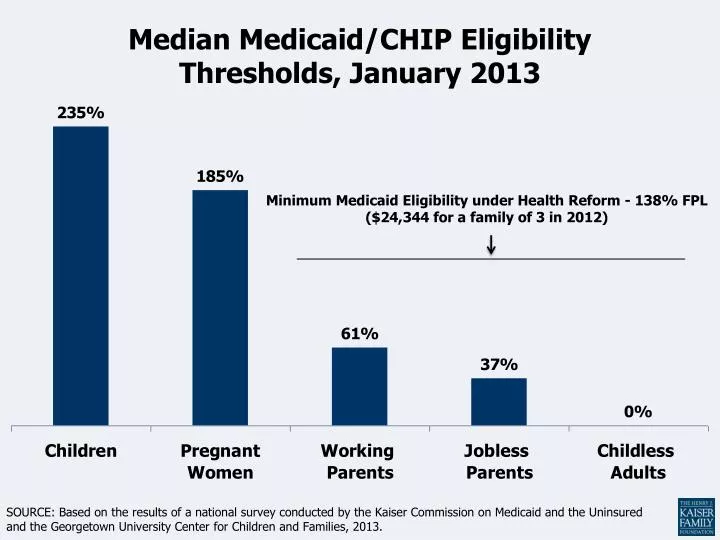
SOURCE: Based on the results of a national survey conducted by the Kaiser Commission on Medicaid and the Uninsured and the Georgetown University Center for Children and Families, 2013. Median Medicaid/CHIP Eligibility Thresholds, January 2013.

E N D
SOURCE: Based on the results of a national survey conducted by the Kaiser Commission on Medicaid and the Uninsured and the Georgetown University Center for Children and Families, 2013. Median Medicaid/CHIP Eligibility Thresholds, January 2013 Minimum Medicaid Eligibility under Health Reform - 138% FPL ($24,344 for a family of 3 in 2012)
*Medicaid also includes other public programs: CHIP, other state programs, Medicare and military-related coverage. The federal poverty level for a family of four in 2011 was $22,350. Numbers may not add to 100 due to rounding. SOURCE: KCMU/Urban Institute analysis of 2012 ASEC Supplement to the CPS. Health Insurance Coverage of the Nonelderly, 2011 Federal Poverty Level ≥400% FPL 139-399% FPL (Subsidies) Employer-Sponsored Coverage Uninsured <139% FPL (Medicaid) Medicaid/ Other Public Private Non-Group 266.4 Million Nonelderly 47.9 Million Uninsured
SOURCE: Urban Institute and Kaiser Commission on Medicaid and the Uninsured estimates based on the Census Bureau's March 2011 and 2012 Current Population Survey (CPS: Annual Social and Economic Supplements). Share of Nonelderly Uninsured ≤138% FPL by State, 2010-2011 VT WA ME ND MT NH MN OR MA NY WI SD ID RI MI CT PA WY NJ IA DE OH NE NV IN IL MD CO UT WV VA CA DC KS MO KY NC TN OK SC AZ AR NM GA AL MS TX AK LA FL HI 26% – 47% (17 states, including DC) United States: 51% Uninsured ≤138% FPL 48% – 52% (18 states) 53% - 61% (16 states)
SOURCE: Based on a review of State of the State Addresses, Budgets Proposed by Governors, as well as other public statements made by the Governor. States continue to weigh the Medicaid expansion decision. Executive Activity on the Medicaid Expansion Decision: VT WA ME ND MT NH MN OR MA NY WI SD ID RI MI CT WY PA NJ IA DE OH NE NV IN IL MD CO UT WV VA CA DC KS MO KY NC TN OK SC AZ AR NM GA AL MS TX LA AK FL HI Governor’s Position on the Medicaid Expansion, as of Mar. 5, 2013 Supports Expansion (27 states, including DC) Opposes Expansion (17 states) Weighing Options (7 states)
SOURCE: Urban Institute estimates prepared for the Kaiser Commission on Medicaid and the Uninsured, October 2012. New State and Federal Medicaid Expenditures Under ACA, with All States Expanding Medicaid, 2013-2022 Total: $1,028 Billion
SOURCE: HIPSM 2012. Enrollment Increases Under the ACA With All States Expanding Medicaid, 2016 and 2022 New Eligibles Current Eligibles 12.0 M 14.3 M 5.9 M 7.0 M Total: 17.9 Million Total: 21.3 Million