Download
1 / 1
10 likes | 98 Views
Distributions of mixed layer properties in North Pacific water mass formation areas: comparison of Argo floats and World Ocean Atlas 2001. Frederick M. Bingham 1 , Toshio Suga 2 1 University of North Carolina Wilmington, Center for Marine Science 2 Tohoku University, Department of Geophysics.

E N D
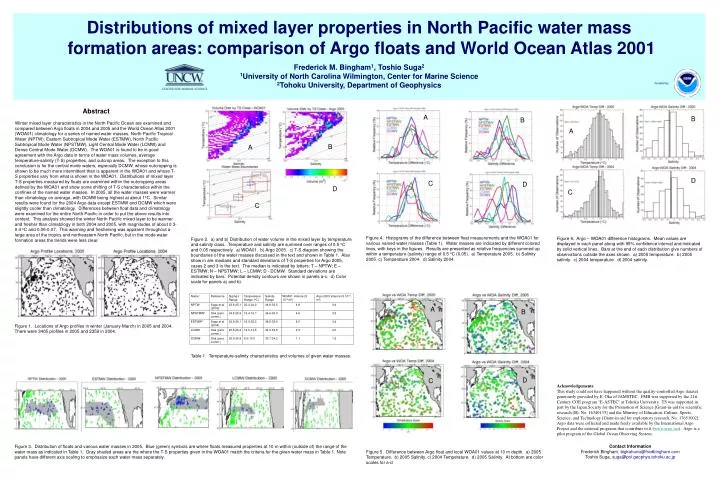
Distributions of mixed layer propertiesin North Pacific water massformation areas: comparison of Argo floatsand World Ocean Atlas 2001 Frederick M. Bingham1, Toshio Suga2 1University of North Carolina Wilmington, Center for Marine Science2Tohoku University, Department of Geophysics Funded by: • Abstract • Winter mixed layer characteristics in the North Pacific Ocean are examined and compared between Argo floats in 2004 and 2005 and the World Ocean Atlas 2001 (WOA01) climatology for a series of named water masses, North Pacific Tropical Water (NPTW), Eastern Subtropical Mode Water (ESTMW), North Pacific Subtropical Mode Water (NPSTMW), Light Central Mode Water (LCMW) and Dense Central Mode Water (DCMW). The WOA01 is found to be in good agreement with the Argo data in terms of water mass volumes, average temperature-salinity (T-S) properties, and outcrop areas. The exception to this conclusion is for the central mode waters, especially DCMW, whose outcropping is shown to be much more intermittent than is apparent in the WOA01 and whose T-S properties vary from what is shown in the WOA01. Distributions of mixed layer T-S properties measured by floats are examined within the outcropping areas defined by the WOA01 and show some shifting of T-S characteristics within the confines of the named water masses. In 2005, all the water masses were warmer than climatology on average, with DCMW being highest at about 1oC. Similar results were found for the 2004 Argo data except ESTMW and DCMW which were slightly cooler than climatology. Differences between float data and climatology were examined for the entire North Pacific in order to put the above results into context. This analysis showed the winter North Pacific mixed layer to be warmer and fresher than climatology in both 2004 and 2005, with magnitudes of about 0.3-0.4 oC and 0.06-0.07. This warming and freshening was apparent throughout a large area of the tropics and northeastern North Pacific, but in the mode water formation areas the trends were less clear. A B B A B A D C D D C C Figure 4. Histograms of the difference between float measurements and the WOA01 for various named water masses (Table 1). Water masses are indicated by different colored lines, with keys in the figures. Results are presented as relative frequencies summed up within a temperature (salinity) range of 0.5 oC (0.05). a) Temperature 2005. b) Salinity 2005. c) Temperature 2004. d) Salinity 2004. Figure 6. Argo – WOA01 difference histograms. Mean values are displayed in each panel along with 95% confidence interval and indicated by solid vertical lines. Bars at the end of each distribution give numbers of observations outside the axes shown. a) 2005 temperature. b) 2005 salinity. c) 2004 temperature. d) 2004 salinity. Figure 2. a) and b) Distribution of water volume in the mixed layer by temperature and salinity class. Temperature and salinity are summed over ranges of 0.5 oC and 0.05 respectively. a) WOA01. b) Argo 2005. c) T-S diagram showing the boundaries of the water masses discussed in the text and shown in Table 1. Also show in are medians and standard deviations of T-S properties for Argo 2005, cases 2 and 3 in the text. The median is indicated by letters: T – NPTW; E – ESTMW; N – NPSTMW; L – LCMW; D - DCMW. Standard deviations are indicated by bars. Potential density contours are shown in panels a-c. d) Color scale for panels a) and b). A B Figure 1. Locations of Argo profiles in winter (January-March) in 2005 and 2004. There were 3405 profiles in 2005 and 2359 in 2004. Table 1. Temperature-salinity characteristics and volumes of given water masses. D C Acknowledgements This study could not have happened without the quality-controlled Argo dataset generously provided by E. Oka of JAMSTEC. FMB was supported by the 21st Century COE program "E-ASTEC" at Tohoku University. TS was supported in part by the Japan Society for the Promotion of Science [Grant-in-aid for scientific research (B), No. 16340135] and the Ministry of Education, Culture, Sports, Science, and Technology [Grant-in-aid for exploratory research, No. 17651002]. Argo data were collected and made freely available by the International Argo Project and the national programs that contribute to it (www.argo.net). Argo is a pilot program of the Global Ocean Observing System. Aug 7 Contact Information Frederick Bingham, bigkahuna@fredbingham.com Toshio Suga, suga@pol.geophys.tohoku.ac.jp Figure 3. Distribution of floats and various water masses in 2005. Blue (green) symbols are where floats measured properties at 10 m within (outside of) the range of the water mass as indicated in Table 1. Gray shaded areas are the where the T-S properties given in the WOA01 match the criteria for the given water mass in Table 1. Note panels have different axis scaling to emphasize each water mass separately. Figure 5. Difference between Argo float and local WOA01 values at 10 m depth. a) 2005 Temperature. b) 2005 Salinity. c) 2004 Temperature. d) 2005 Salinity. At bottom are color scales for a-d