Download
1 / 43
450 likes | 707 Views
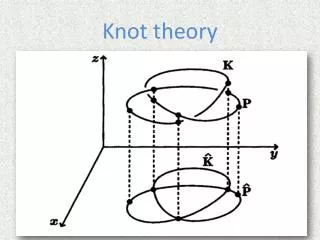
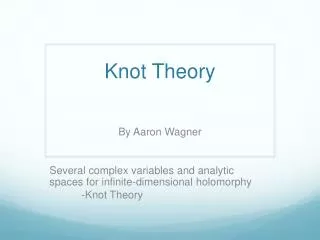
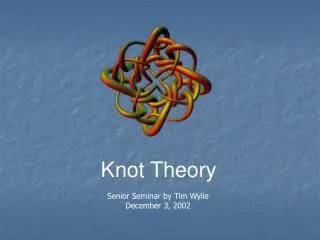
Reading Knot Diagrams. A Computer Vision Project By Dale Clements Advisors: Victor Milenkovic & Kenneth Baker. Knot Theory. Dr. Baker Mathematical Knots a knot is an embedding of a circle in 3-dimensional Euclidean space Closed Represented by a Knot Diagram. Knot Diagrams.

E N D
Reading Knot Diagrams A Computer Vision Project By Dale Clements Advisors: Victor Milenkovic & Kenneth Baker
Knot Theory • Dr. Baker • Mathematical Knots • a knot is an embedding of a circle in 3-dimensional Euclidean space • Closed • Represented by a Knot Diagram
Knot Diagrams • Flat (2D) image • Represents Three Dimensions • Over/Under crossings are depth
The Mission • Given: A hand-drawn diagram like this • Generate: A program-readable representation of the knot. • SnapPy • Rhino
The Steps • Start by pulling out pixels that represent where the curves are. • These will be coordinates
The Steps • Start by pulling out pixels that represent where the curves are. • These will be coordinates • Next connect endpoints to make a continuous knot • Because of the way knot diagrams are drawn, and jump like this represents an “under” crossing
First things first – Reading the Curves • Image of a line isn’t a line • It’s a blob of pixels
First things first – Reading the Curves • Image of a line isn’t a line • It’s a blob of pixels • But I just want the ones in the middle • Sequential
First things first – Reading the Curves • Enter Thinning • Zhang / Suen Thinning
Binary Images • Thinning and other useful algorithms can only be applied to binary images. • Usually color data of a pixel is stored ARGB • Alpha, Red, Green, Blue • (0–255, 0–255, 0–255, 0–255) • Like it sounds, Binary images just store 1 or 0
BoofCV • There’s a ton of other operations that I can just use an external library for • Enter BoofCV • Computer Vision Library • Java • Well documented • BoofCV.org
Several Steps to Clean Up The Image This looks pretty clean, but there’s more I need to do before I can use it
Several Steps to Clean Up The Image This looks pretty clean, but there’s more I need to do before I can use it Once it’s converted to binary, you can see it’s kind of a mess.
Several Steps to Clean Up The Image This looks pretty clean, but there’s more I need to do before I can use it Once it’s converted to binary, you can see it’s kind of a mess. Luckily BoofCV has an “Erode” operation. This looks like something I can try to Thin.
Thinning • Came to about 200 lines of code • Took more time to implement than it should have • One source provided a false mathematical definition of “Connectivity” • After some modification, gave me exactly what I was looking for
Thinning 4 3 2 1
“Blobbing” • Just separates the segments • It’s a BoofCV operation on binary images
“Blobbing” • Just separates the segments • It’s a BoofCV operation on binary images • But the pixels aren’t sequential from end to end. • Gradient goes from Darker Pixels = First • Lighter Pixels = Last
Segments • Create Segment class • Contains a list of points • Contains a list of endpoints (size 2) • Has Endpoint subclass • Contains Parent • Neighbor • Some other things
Segments Order the points from endpoint to endpoint Direction isn’t right… We need to connect endpoints
Connect Segments This is the next big part of the project Two ways of comparing whether two endpoints should go together.
Connect Segments • This is the next big part of the project • Two ways of comparing whether two endpoints should go together. • Proximity
Connect Segments • This is the next big part of the project • Two ways of comparing whether two endpoints should go together. • Proximity • Angles
Connect Segments • This is the next big part of the project • Two ways of comparing whether two endpoints should go together. • Proximity • Angles • Of course there are pros and cons to both, so I’d have to use both.
Connect Segments Once all of the segments are connected, I need just need to add them to a list in the right order. I can scan through the endpoint, their neighbors, and their parent(segment) and add those segments to a list of segments in the right order.
Connect Segments Once all of the segments are connected, I need just need to add them to a list in the right order. And while I do that, I sometimes need to reverse the order of points in each segment.
So you do all that, what do you get? • I have a list of segments and each segment has a list of points. • When I scan through them, I have in proper order a list of coordinates that represent the curves of the knot. • Every jump from one segment to another is an “under” crossing
SnapPy • Knot analysis program
SnapPy List of vertices What vertices connect to what
Future Finish writing to a SnapPy file Write to a Rhino readable file like IGES More features to make up for human error in drawing the knot Develop an Android application that uses the algorithm