Download
1 / 16
160 likes | 267 Views
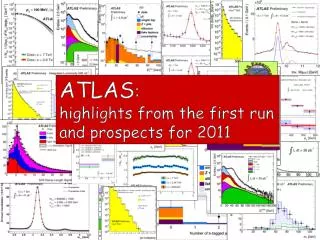
The 2011 Run: Availability and Statistics. Alick Macpherson Evian 2011 12 December 2011. Luminosity Production. Luminosity Production - Well above Targets set in Evian 2010 - 2011 Proton Run: 156.6 days [53.0 days of SB] => 123 x( 2010 Del Lumi)

E N D
The 2011 Run: Availability and Statistics • Alick Macpherson • Evian 2011 • 12 December 2011
Luminosity Production • Luminosity Production • - Well above Targets set in Evian 2010 • - 2011 Proton Run: 156.6 days [53.0 days of SB] • => 123 x( 2010 Del Lumi) • - 2011 Ions Run: 28.9 days [ 8.0 days of SB] • =>16.6 x (2010 Del Lumi) • - 1.38 TeV Proton Run: 3.15 days, LDel = 345.1 µb-1
2011 Run Records • Proton Run: From Fill 1542 - 2267 [ 15th Feb - 30th Oct ] • Most Luminosity delivered in a single Fill: LDEL = 123.3 pb-1 in Fill 2219 • Highest Peak Luminosity: LPEAK = 3693.88 (µb.s)-1 in Fill 2208 • Longest Stable Beams period: 25 hrs 23 min • Shortest Stable Beams period: 3 min 47 sec • Fastest Turn around [SB->SB]: 2 hrs 7 min • Fastest Turn around with 1380 bunches [SB->SB]: 2 hrs 7 min • Ion Run: From Fill 2289 - 2352 [ 11th Nov - 6th Dec] • Most Luminosity delivered in a single Fill: LDEL = 6960.0 mb-1 in Fill 2330 • Highest Peak Luminosity: LPEAK = 2010.0 (b.s)-1 in Fill 2294 • Longest Stable Beams period: 8 hrs 4 min • Shortest Stable Beams period: 20 min 48 sec • Fastest Turnaround [SB->SB]: 2hrs 37min
ß* = 1m Reduced Emittance Getting More Luminosity
Emittance variations more prevalent for Beam 2. Both beams show variations as bunch intensities increase. Bunch length remains constant over 2011 and no fluctuations within a fill Bunch shapes over the proton run Beam 1 Beam 2
Hubner factor H = 11.57 x LDel /(D x LPeak) => H = 0.202 D = 89.15 days LPeak = 2572.0 (µb.s)-1 LDel = 4.006 fb-1 LHC 2011 Run: Efficiency HExpected = 0.2 • - NB: based on Access • (EIS Beam Status) • - All other categories use: • - Beam mode • - Beam presence • - Lumi Production =>1380b
High ß* Physics Hubner factor - Ions H = 11.57 x LDel /(D x LPeak) => H = 0.171 D = 21.75 days LPeak = 375.0 (b.s)-1 LDel = 120.5 µb-1 LHC 2011 Run: Efficiency - II
Injection SPS supercycle: 41 BP => 49.2 sec Could be reduced to 28 BP • Dedicated LHC filling (SPS): 28 BP =>33.6 sec • Recovered Time = 32 x 800 x 15.6sec • = 5.56 days • Dedicated LHC filling: • Not just a technical issue: Sharing with other SPS Users
Time at Injection It just feels like filling with Ions takes so much longer ...
Stable Beams and Turnaround Protons Protons • Average Turnaround SB -> Injection: • Protons: 3 hrs 42 min Ions: 3 hrs 23 min • Average Turnaround SB -> SB: • Protons: 5 hrs 8 min Ions: 5 hrs 25 min
Recorded Faults - As noted in the logbook Issues - Not all faults recorded - We need to revise the reporting mechanism - Significant number of accesses for things not listed as faults (eg QPS) - “OP rule” of not having concurrent faults => some faults are hidden in the shadow of others. - We need to revise our fault tracking mechanism - Proposal: Regular and systematic evaluation of faults for 2012. Many non-critical faults were hidden in the shadow of cryogenics downtimes and QPS accesses
Crates CCs COM US25 Crate 81 P6 Vac + P18 EL PLC US85 P8 Oil Valve 400V Oil filters P8 Legend: : PLC P8_QSCB : Single Event (SEU) PLC US45 PLC P8 PLC US85 PLC US45 PLC US65 Induced CCs P8/P4 Cryo Global - Serge’s View 13
5th August Intervention to improve PLC Redundancy against SEUs may have reduced downtime! Cryo Global Downtime 3 Time Regions of Recovery Short: less than 2 hrs Medium: 2 hrs < recovery< 12 hrs Long: greater than 12 hrs 14
Right of IP Left of IP 18m from IP ATLAS End of common BP ATLAS Static Pressure Relative Pressure Increase [Current Normalized] 18m from IP Rel. Pressure = (DP-SP)/SP x I0/ISSB SP = Static Pressure (No Beam) DP = Dynamic Pressure CMS End of common BP CMS Vacuum Conditions - an example ATLAS Fill 2006 - Intermittent high pressure levels at ~18m right of CMS for all of 2011. - Impaired detector performance when high beam intensities. -No such asymmetry in ATLAS
Summary and Comments • Operational Performance of the machine has been excellent • Over ~ 30% of allocated Physics time has been in Stable Beams • “Problem free” turnaround times can be well under 3 hrs • Injection is the obvious place to trim the turnaround time • Fault tracking has improved over 2011 • Automatic analysis scripts are run on a fill-by-fill basis ( Supertable etc) • Data pulled from logging, LSA, PM ,logbook databases (soon Cryo and TI DBs) • Fault tracking Issues • tracking is incomplete => not all faults recorded. • Tools and procedure not yet in place for regular and systematic evaluation of faults and issues. Need to develop over Xmas Stop. • Analysis of performance with beam • Tools emerging to develop run based overviews of performance • Systematic evaluation of conditions needs to established for 2012. • Issues: Data quality and data surveillance needs to be addressed • As of 2012, we start to integrate Expt data into operation/analysis framework