Download
1 / 20
200 likes | 353 Views
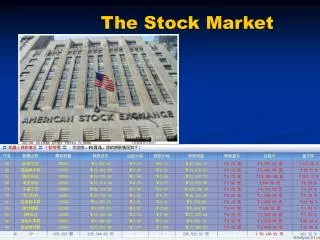
The Stock Market. Ticker Symbols. Started in the 1800s and the telegraph Info transmitted over telegraph wires Companies assigned one and two letter symbols Most actively traded companies had one letter Unique for each company NYSE = 1 or 2 letter symbols NYSE/AMEX = 3 letter symbols

E N D
Ticker Symbols • Started in the 1800s and the telegraph • Info transmitted over telegraph wires • Companies assigned one and two letter symbols • Most actively traded companies had one letter • Unique for each company • NYSE = 1 or 2 letter symbols • NYSE/AMEX = 3 letter symbols • NASDAQ = > 3 letter symbols
Ticker Symbols cont. Some symbols contain an extra letter or two, usually preceded by a period, in order to note something about the particular stock. For example, BRK.B refers to lower-value "Class B" stock from the company Berkshire Hathaway (BRK).
Last Trade • This refers, for all intents and purposes, to the current value of the stock. Technically, last trade is the last reported price at which a share of the stock was sold, usually delayed around 15 minutes from the actual floor of the stock exchange. • According to our example, the current value of one share of Nokia Corp. is $20.10. • Newspapers list this figure under the heading "Close," because by the time they go to press, the stock market has already closed.
Trade Time • Trade time is the time at which the latest price was reported. • In this case, it was 1:50 p.m. Eastern Time.
Change • Change refers to the difference between the current value and the closing price of the previous day. • The price of one share of Nokia stock has changed $0.07. • The downward arrow indicates that it has dropped by $0.07. An upward arrow would indicate a gain instead. • Some quotes use the heading "Net Change" for this figure.
Previous Close • Previous close is the final value of the stock on the previous day. • In this case, $34.72.
Open • Open refers to the starting value of the stock on the current day.
Bid and Ask • The bid and ask prices reflects the actual wheeling and dealing happening on the floor of the stock market. Bid identifies the highest price per share that stock traders are currently offering to buy a particular stock. The ask price identifies the lowest price per share that stock traders are currently offering to sell a particular stock. • The bid price for a share of Intel is $20.09 The figure next to the bid price (35200) is the number of shares the buyer is seeking for this price. • The ask price for a share of Intel is $20.10. The figure next to the bid price (16800) is the number of shares the the seller is seeking to sell for this price. • Only when the buyer and seller reach a compromise does a trade take place, setting the value of the stock.
1yTarget Est. • The 1 year target estimate is the projected price of one share for a year into the future. The figure is based on the median projection of a number of market analysts. If you enter a stock's ticker symbol, Google will generate a stock quote as the first result. • The 1 Year Target Estimate for Intel is $26.64. If one were to go only by this projection, it would be adventageous to buy shares of Intel at the current $20.10—however, analysts are often wrong.
Day’s Range • The day's range specifies the lowest and highest price at which the stock has traded throughout the day. • The lowest price for Intel in this example is $19.50, while the highest is $20.30. • Quotes in newspapers usually list the range under two separate headings: "Low" and "High."
52wk Range • The 52 week range specifies the lowest and highest price at which the stock has traded in the past year. • The lowest price for share of Intel in the past year was $18.05, while the highest was $27.99. • Quotes in newspapers usually list the range under two separate headings: "52wk Low" and "52wk High." If this range is extremely wide, it warrants further research. It could either mean a huge loss or a huge gain—and either way, an unpredictable, volatile stock.
Volume • Volume refers to the total number of shares traded throughout the day. • 58,957,610 shares in Intel exchanged hands on the day in queston. • In order to save print space, stock quotes in newspapers often round to the nearest hundred and omit the zeros on the end. For example, the volume of Intel might list in a newspaper as 589576.
Average Volume (3m) • Average volume identifies the average daily total number of shares traded in the past three months.
Market Cap • Market capitalization is the total dollar value of the company. • This figure determined by multiplying the cost per share in the last trade ($20.10) by the number of shares. • Intel is currently worth $117,40B ("B" as in billion.)
P/E • The Price/Earnings ratio is a figure used to project the earning potential of a stock. • The ratio is calculated by dividing the current price of a share by its overall earnings (price increase) in the past year. • The P/E ratio of Intel is 17.11. Stock with a higher P/E ratio (over 25) is considered to have high expectatios, while stock with a lower ratio (under 20) is not expected to do anything spectacular. • Companies with high P/E ratios are more likely to be considered "risky" investments than those with low P/E ratios, since a high P/E ratio signifies high expectations. • Comparing P/E ratios is most valuable for companies within the same industry. • A higher P/E ratio means that investors are paying more for each unit of net income, so the stock is more expensive compared to one with lower P/E ratio.
EPS • EPS is the stock's earnings per share for the last quarter. • Intel's EPS is $1.18. • In other words, if you had purchased one share of Intel at the beginning of the last quarter, you would have earned $1.18 by the end. • Generally considered to be the single most important variable in determining a share’s price. • An important aspect of EPS that's often ignored is the capital that is required to generate the earnings (net income) in the calculation. Two companies could generate the same EPS number, but one could do so with less equity (investment) - that company would be more efficient at using its capital to generate income and, all other things being equal, would be a "better" company.
Div & Yield • Dividend and Yield are two figures that represent the amount of money paid to shareholders in dividends. • Dividends are regular payments made to shareholders based on a company's profits. In the last quarter, Intel shareholders earned 51 cents in dividends, per each share owned. The dividend can be a useful gauge of a company's financial health. If it's too high a percentage of the earnings per share (over 75%), it may indicate that the company is not reinvesting enough of its profits to sustain itself. • Yield measures the dividend as a percentage of each share. Intel's yield, therefore, is 2.50%. (In other words, 51 cents is 2.50% of the current share price of $20.10). A company with a very high yield in comparison to that of its competitors may be in trouble. According to the New York Times: an extremely high stock yield could offer one of the easiest ways to spot a company on the verge of financial distress.