Download
1 / 41
410 likes | 560 Views
MATH ANXIETY AMONG MINORITY STUDENTS IN HIGH POVERTY SCHOOLS WHO FAILED ALGEBRA . Presented by: Dr. Felicia Clark Math Coordinator LAUSD – District 8. NCSM St. Louis, Missouri April 2006. Purpose of The Study.

E N D
MATH ANXIETY AMONG MINORITY STUDENTS IN HIGH POVERTY SCHOOLS WHO FAILED ALGEBRA Presented by: Dr. Felicia Clark Math Coordinator LAUSD – District 8 NCSM St. Louis, Missouri April 2006
Purpose of The Study • To gain insight into the academic needs of students who repeated algebra so that we can better meet their needs.
Overview of Study • The 98-item Math Anxiety Rating Scale for Adolescents (MARS-A) was given to high school students who were repeating algebra • Students were in high poverty schools with populations that were 95% or higher African-American and Latino • 174 participants • 90 girls • 84 boys • 105-9th graders • 33-10th graders • 34-11th graders • 2-12th graders • Ethnic Groups 99 (57%) Latino 59 (34%) African-American 16 (9%) “other” 6 of these 16 gave no response
Anxiety Defined • “A process of repeated vacillations between interruption and concentration that interferes with knowledge acquisition, storage, and retrieval” Cara Garcia • “The emotions clutter one’s understanding and recall of ideas as one attempts to solve math problems” Marilyn Curtain-Phillips • A feeling of “sudden death… it is an obsession with the idea that everyone knows that I don’t understand. I’d better not draw attention to myself by asking questions.” Sheila Tobias
Math Anxiety and Poor Performance in Math • Math Anxiety Contributes to • Math Avoidance Contributes to • Innumeracy “Many people think of mathematics as a punishment or something that induces stress” (Zaslavsky, 1994)
Innumeracy Innumeracy is the mathematical equivalence of illiteracy. “Innumeracy, an inability to deal comfortably with the fundamental notions of number and chance, plagues far too many otherwise knowledgeable citizens.” Paulos (2001) Why study students who fail?
Over 1 in 5 US Adults Are Innumerate 21% of Americans possess numeracy skills at the lowest level . . . [which] means that people cannot . . . work out the change from $2 when buying goods worth $1.58. (Murray, 2000. p. 2)
England Mirrors the US in Innumeracy Rates Britain addressed their innumeracy issues with mathematical reforms in their schools. “This is a shocking state of affairs in this rich country, (is) a sad reflection on past decades of schooling and policy priorities over the years” Sir Claus Moser British Educationalist
Focus on Changing Instructional Practices • Math Leaders often focus on logistical changes because that is something we can control (i.e. reduce class size, change schedule, etc.) “Most efforts to improve education fail because they simply don't have any impact on the quality of teaching inside the classroom… It is teaching, not teachers, that must be changed.” The Teaching Gap Stigler and Hiebert (1999)
Red Herring Approaches to Reform in US- Class Size Reduction *Results are from 8th grade students
Red Herring Approaches to Reform in US- Increase Time Spent on Math
If Innumeracy is a National Crisis… Why Study Failing Students who are minority and living in poverty?
Rationale for Focusing on High Poverty Minority Students “Students who are both minority and high poverty have not only a double achievement gap to overcome, but they are expected to overcome this gap regardless of systemic barriers such as lack of access to rigorous content.” (Clark, 2004)
The Venn Diagram of Social Needs “If we figure out the needs of the most distressed population of any group, as if it were the center of the Venn Diagram, then we have tools to reach all other populations.” - (Clark, 2006)
Targeted Location Service Planning Area (SPA) 6 of Los Angeles County • “Murder Capitol of the World” (2002) • Highest in dropouts • Highest Poverty Rate (86,000 Latino and 32,000 African-American children) • Highest in teen pregnancy • Highest in all of the at risk categories (arrest rate, health challenges, incarcerated parents, homelessness, etc.)
Systemic Barriers Robert Moses (2001) describes the systemic lack of access minorities have to higher math as a “sharecropper’s education,” drawing on an analogy to the post slavery era when African - Americans were intentionally undereducated to keep them employed as farm laborers for low or non-existent wages. Moses considers math literacy to be the new civil rights issue. Moses, R., Cobb, C.E., (2001) Radical Equations: Math Literacy and Civil Rights. Beacon Press, Boston Massachusetts.
College Graduates by Age 24 Source: Tom Mortenson, Research Seminar on Public Policy Analysis of Opportunity for Post Secondary, 1997. Ed Trust Foundation, 2000
The Importance of Algebra Algebra is a “Gatekeeper Subject” meaning that successful completion of the course is a high predictor of future success; including college graduation.
The OpportunityGapBased on Socioeconomic Status West Ed Research Laboratories
Math Anxiety Rating Scale for Adolescents (MARS-A) • 98 ITEMS 5 item scale • Choices to Rate Anxiety Level • Not at all (0) • A little (1) • A fair amount (2) • Much (3) • Very much (4) RANGE OF ANXIETY SCORE: 0 - 392
Math Anxiety LevelsAnxiety Levels of 9th Grade Students Compared to the Norm Group.
Math Anxiety LevelsAnxiety Levels of 10th Grade Students Compared to the Norm Group.
Math Anxiety LevelsAnxiety Levels of 11th Grade Students Compared to the Norm Group.
Math Anxiety Levels Based on Gender and Ethnicity Compared Within Study (results are not statistically significant)
Statistical Significance of Gender and Ethnicity and Math Anxiety Levels Mean Square F Sig. Gender 10,106.27 3.07 0.08 Ethnicity 0.60 0.00 0.99 Gender and Ethnicity 165.58 0.05 0.823 P < .05 level = statistically significant
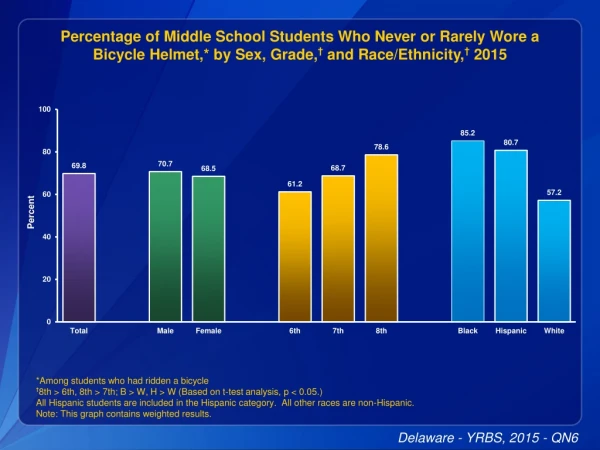
Highest Levels of Math Anxiety Yielded by the MARS-A (con’t) • Reading and interpreting graphs or chart • Being asked to explain how you arrived at a particular answer for a problem Opening a math or statistics book and seeing a page full of problems Asking your math teacher after class about something you did not understand Having a friend try to teach you how to do a math problem and finding that you cannot understand what is being said IMPLICATIONS… must have SAFE ENVIRONMENT Math Anxiety Reduction Pedagogy is essential (Visuals, fewer problems, supportive/collaborative group work without a hierarchy, manipulatives, conversations about math -not 1 student explaining)
Summary • Math anxiety levels were not relevant to grade level (Conclusion: repeating a class does not help anxiety) • Males experienced moderate levels of math anxiety and females experienced higher levels of math anxiety than the males but results not statistically significant (Conclusion: gender should not l be the main focus) • Test taking/performance procedures (how they are evaluated) had the highest level of statistical significance for anxiety (Conclusion: traditional assessment procedures give a false read on what this population knows) • Basic skills did not produce anxiety for the algebra students (Conclusion: new learning should create low to moderate anxiety. Perhaps there is no new learning w/basic skills)
Finding • “Students in the study reported high anxiety related to classroom procedures. Therefore, a positive emotional (e.g., low anxiety) experience while these students learn algebra may be more relevant to their success in higher math than relearning basic skills.” (Clark, 2006)
Contact Information: Dr. Felicia Clark Math Coordinator Los Angeles Unified School District 8 Felicia.clark@lausd.net