Download
1 / 71
720 likes | 975 Views
Potato Economics: Potato Markets, Marketing & Cost of Production . Potato Science PLSC 490/590 Lecture 20 April 8, 2014. Paul E. Patterson Extension Agricultural Economist pattersn@uidaho.edu http://web.cals.uidaho.edu/idahoagbiz/. Objectives. A short lesson in economics

E N D
Potato Economics: Potato Markets, Marketing & Cost of Production Potato Science PLSC 490/590 Lecture 20 April 8, 2014 Paul E. Patterson Extension Agricultural Economistpattersn@uidaho.edu http://web.cals.uidaho.edu/idahoagbiz/
Objectives • A short lesson in economics • Market-based economies: supply & demand • Overview of potato markets & marketing • Overview of developing cost of production estimates • Uses of cost of production • Example of Idaho cost of production
Economic Overview • Economic systems answer 3 basic resource allocation questions: • 1- What? • 2- How? • 3- For whom? • Shall goods and services be produced • Economic systems: • Market-based economies (capitalist) • Centrally planned economies (socialist) • Mixed
Market-based economies: supply & demand set price $ Supply P1 Demand Q1 Quantity
Economic Overview • What are things that you want to know before you produce a crop? • What to produce? • Where to sell? • When to sell? • Market Analysis can provide answers to important questions: • Supply & Demand • Trends • Prices
Economic Overview • Demand Analysis : + & - • What factors influence consumer demand for food? • Consumer tastes & preferences • Diet fads (Atkins) • Health issues (obesity, fat, acrylamide) • Demographic shifts (age, ethnicity) • Income level • Where meals are consumed (home or away from home) • Form of meals consumed (processing and convenience) • Price of product and price of substitutes
Economic Overview • Supply Analysis : + & - • What factors influence supply? • Producer preferences & expectations • Commodity price and price expectations • Price of alternative crops • Input prices • Technology • Government policy & programs • Environmental factors • Weather, disease, pests
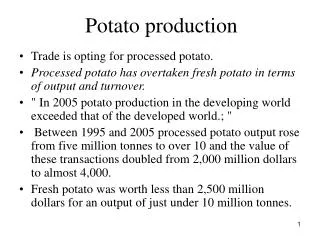
Potato Market Overview • Potato Market Structure & Market Channels • What markets are available for potatoes and how are prices determined? • Fresh: consignment, formula pricings • Process • Frozen: mostly pre-season, collective bargaining contracts, some open-market purchases • Dehydration: some pre-season contracts, mostly sale of washed processes grade from sheds • Seed: some multi-year & formula prices
Market-based economies: supply & demand set price $ Supply P1 Demand Q1 Quantity
Cost of Production & Supply $ Supply . C3 C2 . . C1 Q2 Q1 Q2 Quantity
Cost of Production Overview • Does cost of production matter? • Does the market care how much it cost you to raise potatoes or any other crop?
Overview • Short run – cost of production does not matter • Long run – cost of production does matter • “Cost of production would have not effect on competitive price if it could have none on supply.” • John Stuart Mill, 19th century economist
Although potato production practices may be similar among different growers, each farm has a unique set of resources with different levels of productivity, different production problems, and therefore different costs.
It Depends: Acre vs. Cwt Location Variety Farm Size Storage Conventional vs. Organic Water Source & Irrigation System How much does it cost to raise potatoes?
It Depends: How much does it cost to raise potatoes in Idaho?
Idaho 2013 RB Production Costs: no storage Cost to grow, harvest, and sort .
Measuring Cost of Production • Traditional uses: • Farm-level decisions & analysis • Policy & government program analysis • Performance analysis
Overview of Costs & Returns • Enterprise budgets • Commonly used to characterize costs & returns • What is an enterprise • An enterprise is any coherent portion of the farm business that can be separated and analyzed as a distinct entity (profit center) • An enterprise uses inputs & incurs costs while producing either products or services • Traditional production unit • Acres (hectares) for crops • Head for livestock
Overview of Costs and Returns Estimates • Because CAR estimates are typically structured for an enterprise, they are frequently referred to as enterprise budgets • An enterprise may produce more than one product, making it difficult to focus only on a single commodity • Examples: • A wheat enterprise produces grain and straw • A seed potato enterprise produces seed and tops • A dairy enterprise produces milk, calves and cull cows
Overview of Costs and Returns Estimates • An enterprise can be defined broadly or narrowly • Broad classification: dairy, beef, crops • Narrow classification: milk, calves, wheat, potato, barley, sugarbeets, etc. • An enterprise can be structured differently for different types of analysis • Most frequently, an enterprise is defined on a commodity basis
Overview of Costs and Returns Estimates • CAR estimates can also be categorized by the type of management system • Management system combined with a commodity: • Conventional tillage vs. No-till winter wheat • Irrigated spring barley vs. rain fed spring barley • Potato production with or without storage • Roundup Ready Sugarbeets • These designations are useful and help avoid confusion
Overview of Costs and Returns Estimates • Time frame of CAR estimates: • Can be based on historical data – looking back • Can be projected data – looking forward • Time Frameof CAR estimates: • Typically 12 months, or a production cycle • Can be longer or shorter • An orchard or a vineyard would require a longer time period
Overview of Costs and Returns Estimates • Scope of CAR estimates: • CAR estimates can represent a single farm, the average of a group of farms in a region or nation, or a composite or model farm • USDA often develops an average or composite CAR estimates to evaluate policies • Universities normally develop CAR estimates for a model farm to evaluate alternative technologies and cropping systems, as well as market opportunities
Cost of Production • Revenue: • Price x Yield • Correspondence between price and yield • Field-run or paid • Costs: • Operating (variable) • Ownership (fixed)
Cost of Production • Operating costs typically vary directly with production and involve inputs consumed in one production cycle (typically one year): • seed, fertilizer, chemicals, fuel, water, labor, etc.
Cost of Production • Ownership costs typically don’t vary directly with production and involve inputs (depreciable assets) lasting more than one production cycle: • machinery, irrigation system, breeding livestock, and sometimes management, owner/operator labor and land
Cost of Production • Two basic means of calculating cost of production • 1. Farmers allocate costs based on accounting records • Track, accumulate and then allocate costs • Structure of chart of accounts is critical • Some costs can easily be assigned to a given crop or field, while other costs cannot • Allocation procedures are needed • Machinery operating expense: fuel, repairs, etc. • Machinery ownership costs
Cost of Production • Two basic means of calculating cost of production • 2. Universities Generate Costs • Budget generator software “generates” cost for field operations specific to a crop • Machinery operating expenses are generated for each operation and accumulated for the enterprise • Labor, fuel, repairs and ownership costs • Difficult to calculate enterprise specific “overhead” expenses, such as legal, accounting, utilities, etc.
U of I Cost of Production Estimates • Historical not projected • Crop costs & returns estimates “published” biennially in odd-numbered years • 75 - 80 crop enterprise budgets • 4 regional areas: • Northern • Southwestern (Treasure Valley) • Southcentral (Magic Valley) • Eastern Idaho • Dryland & Irrigated
U of I Procedures & Assumptions • Typical or representative costs of production estimates, not average • Based on grower surveys, sequence of operations, not cost data from growers • Model farm for each region or sub region
U of I Procedures and Assumptions • Economic costs, not accounting (cash) costs • Opportunity cost (market value) • Machinery: 75% of replacement cost new • Management: 5% of total costs • Overhead: 2.5% of cash operating expenses • Land: crop specific 1-year cash rental value • Surface water, avg. price by region • Pressurization only, per acre-inch water applied
U of I Crop Budget Format • Portable Document Files, or PDFs • 8– 14 page format • Background & assumptions page • Cost per acre with detailed list of inputs, quantities & prices • Cash flow and machinery summary • Sensitivity analysis • Ranging analysis • Monthly storage costs (potatoes only)
U of I Crop Budget Format • Excel spreadsheets • Cost per acre with detailed listing of inputs • Sensitivity analysis • One crop per worksheet • One file per region or sub-region • Crop Enterprise Budget Worksheet data files • Cost per acre with detailed listing of inputs • Sensitivity analysis • One crop per worksheet • One file per region or sub-region
U of I Crop Budgets Yields • Generally based on above average management and are consistent with input use • Based on farm surveys, USDA county or regional yields, as well as expert opinions from extension specialists, county extension educators, fieldmen, etc.
U of I Crop Budgets Input Prices • Based on regional surveys conducted annually • Northern Idaho • Southwestern Idaho • Southcentral Idaho • Eastern Idaho • Chemical fertilizer dealers, seed dealers, irrigation districts & canal companies, fuel distributors • Published as AERS staff paper
Sequence of Field Operations • Based on surveys of farmers • What they do, how they do it and when it is done • Tillage, planting, cultivation, pesticide applications and harvesting • Quantity of inputs applied, when and how applied • Seed, fertilizer, herbicides, insecticides, fungicides, irrigation water
Understanding Operating Costs • Fertilizer – typically pounds of element, not product • N, P2O5, K2O, Zn, micros • Dry nitrogen – priced as urea (46-0-0) • Liquid nitrogen – priced as solution 32 (32-0-0) • Dry phosphorous – price from 11-52-0 with nitrogen valued at price of urea • Liquid phosphorous – price from 10-34-0 with nitrogen valued at price of solution 32 • Potash – valued at price of 0-0-60 (muriate not sulfate)
Understanding Operating Costs • Pesticides (chemicals) • Herbicides, insecticides, fungicides, fumigants • Detailed list of products, quantity & price • Trade name, not common name • Custom & consultants • Input application: fertilizer & some chemicals • Hand labor: onions • Consultant: potatoes, onions, sugarbeets
Understanding Operating Costs • Irrigation • Water assessment (irrigation district, canal co.) • Irrigation system repairs: • Center pivot - cost per acre-inch • Concrete ditch & siphon tube – cost per acre • Irrigation power - costs to pressurize only • Cost per acre-inch • Machinery • Fuel – gallons per acre • Lubricants – cost per acre • Repairs – cost per acre