Download
1 / 22
220 likes | 340 Views
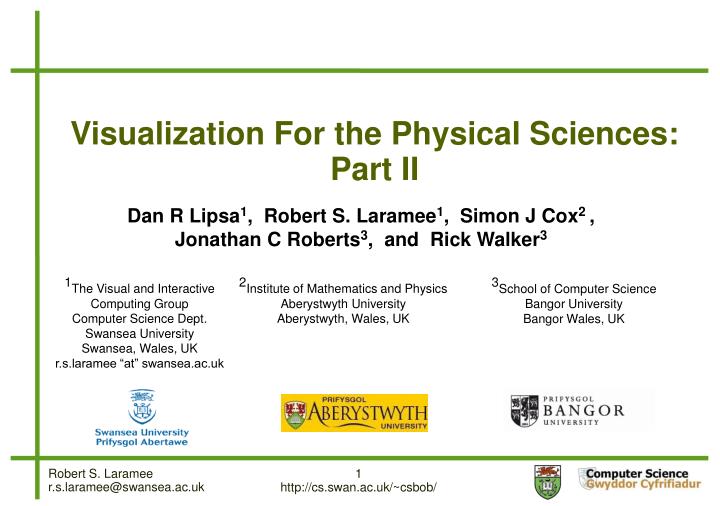
Visualization For the Physical Sciences: Part II. Dan R Lipsa 1 , Robert S. Laramee 1 , Simon J Cox 2 , Jonathan C Roberts 3 , and Rick Walker 3. 1 The Visual and Interactive Computing Group Computer Science Dept. Swansea University Swansea, Wales, UK r.s.laramee “at” swansea.ac.uk.

E N D
Visualization For the Physical Sciences: Part II Dan R Lipsa1, Robert S. Laramee1, Simon J Cox2 , Jonathan C Roberts3, and Rick Walker3 1The Visual and Interactive Computing Group Computer Science Dept. Swansea University Swansea, Wales, UK r.s.laramee “at” swansea.ac.uk 2Institute of Mathematics and Physics Aberystwyth University Aberystwyth, Wales, UK 3School of Computer Science Bangor University Bangor Wales, UK 1http://cs.swan.ac.uk/~csbob/
2http://cs.swan.ac.uk/~csbob/ Overview • Part 1: Dan R Lipsa • Introduction, Challenges • Classification, Overview • Astronomy • Part 2: Robert S. Laramee • Chemistry • Nanotechnology • Physical Chemistry • Organic Chemistry • Earth Sciences • Atmospheric Sciences • Climatology • Hydrology • Geology • Part 3: Richard Walker • Physics • Acoustics • Atomic and Chemical Physics • Gravitation • Mechanics • Optics • Conclusions and Future Work
3http://cs.swan.ac.uk/~csbob/ Chemistry • Chemistry: concerned with properties and structure of substances, transformations they undergo and energy exchanged during those processes [QEE*05]. • (Physics studies structure and behavior of individual atoms while chemistry studies properties and reactions of molecules [bri10b])
4http://cs.swan.ac.uk/~csbob/ Chemistry: Nanotechnology • Nanotechnology: manipulation of atoms, molecules and materials to form structures at nano-meter scales. • Structures typically have new properties than building blocks due to quantum mechanics. • Nanotechnology is interdisciplinary: involving physics, chemistry, biology, material science and engineering. • “Nanotechnology” refers to both science and engineering of field [bri10e]. • Included in our survey are contributions that visualize formation of nanoparticles in turbulent flows [SIG05], and present a web based nanotechnology visualization tool[QMK∗ 06].
5http://cs.swan.ac.uk/~csbob/ Chemistry: Nanotechnology • Hub-based Simulation and Graphics Hardware Accelerated Visualization for Nanotechnology Applications by Qiao et al [QMK∗ 06] • web based application that gives many users access to powerful simulation and visualization resources.
6http://cs.swan.ac.uk/~csbob/ Physical Chemistry • Physical chemistry: measures, correlates and explains quantitative aspects of chemical processes (as opposed to focussing on classes of materials that share common structural and chemical features). • Modern physical chemistry uses quantum mechanical model of atomic and molecular structure [bri10b]. • This section presents visualizations of quantum chemistry simulations [QEE∗ 05, JV09].
7http://cs.swan.ac.uk/~csbob/ Physical Chemistry VolQD: Direct Volume Rendering of Multi-million Atom Quantum Dot Simulations by Qiao et al [QEE*05]. -hardware-accelerated direct volume rendering system for visualizing multivariate wave functions in semi-conducting quantum dot (QD) simulations Contains probability density values of multiple electron orbitals for up to tens of millions of atoms
8http://cs.swan.ac.uk/~csbob/ Physical Chemistry Interactive Volume Rendering of Functional Representations in Quantum Chemistry (Jang and Varetto) [JV09] -evaluate and visualize molecular orbital data on GPU without re-sampling.
9http://cs.swan.ac.uk/~csbob/ Organic Chemistry Organic Chemistry: studies correlation between physical and chemical properties of substances with their structural features. Applicability to design and synthesis of novel molecules with some desired properties. Most visualization for organic chemistry show the 3D structure of molecules [bri10b]. We survey papers that: visualize molecules [BDST04, TCM06] and molecular surfaces [LBPH10, KBE09], Generate triangulations of molecular surfaces [CS04, CS05], Visualize solvent pathlines near protein cavities [BGB∗ 08], Detect anomalous structures in molecular dynamics simulation data [MHM∗ 04], Visualize large molecular dynamics simulations [RE05, GRDE10]
10http://cs.swan.ac.uk/~csbob/ Organic Chemistry Visual Abstractions of Solvent Pathlines near Protein Cavities by Bidmon et al [BGB*08] focuses on visualising solvent paths entering and leaving cavities of protein enables study route and dynamics of exchange of tightly bound internal water molecules with bulk solvent.
11http://cs.swan.ac.uk/~csbob/ Organic Chemistry Coherent Culling and Shading for Large Molecular Dynamics Visualization, Grottel et al [GRDE10] Collection of software and hardware strategies for maximum performance based on rendering only visible objects.
12http://cs.swan.ac.uk/~csbob/ Earth Sciences Earth sciences study solid earth (geologic sciences), its waters (hydrologic sciences), the air around it (atmospheric sciences) and their evolution in time [bri10d]. Consists of many disciplines which include study of water on and within ground, glaciers and ice caps, oceans, atmosphere and its phenomena, world’s climate, physical and chemical makeup of solid earth, study of land formation and geologic history of Earth.
13http://cs.swan.ac.uk/~csbob/ Earth Sciences: Atmospheric • Atmospheric sciences: deal with properties, structure and composition of atmosphere, understanding atmospheric phenomena such as clouds, fog and dew, understanding weather changes and ability to accurately forecast weather. • Survey presents papers that visualize cloud scale weather data [REHL03], visualize warm rain formation, compare weather models with radar observation [SYS∗ 06] and analyze air pollution [QCX∗ 07].
14http://cs.swan.ac.uk/~csbob/ Earth Sciences: Atmospheric An Atmospheric Visual Analysis and Exploration System by Song et al. [SYS∗ 06] -focuses on (1) understanding warm rain formation and (2) comparison of weather prediction models vs radar observations.
15http://cs.swan.ac.uk/~csbob/ Earth Sciences:Atmospheric Visual Analysis of the Air Pollution Problem in Hong Kong by Qu et al [QCX∗ 07] -information visualization centered system for weather data visualization
16http://cs.swan.ac.uk/~csbob/ Earth Sciences: Climatology Climatology:[bri10c] concerned with climate differences between different regions and climate changes over long periods. Climatology seeks to identify slow acting influences on climate and identify consequences of climate change. We review papers that visualize climate variability changes [JBMS09], identify regions in atmosphere acting as indicators for climate change [KLM∗ 08] and describe visualization for public-resource climate modeling [SFW04].
17http://cs.swan.ac.uk/~csbob/ Earth Sciences: Climatology Hypothesis Generation in Climate Research with Interactive Visual Data Exploration by Kehrer et al[KLM*08] -aims to identify regions in atmosphere (e.g., certain height layers) which can act as sensitive and robust indicators for climate change.
18http://cs.swan.ac.uk/~csbob/ Earth Sciences: Hydrology • Hydrology: studies waters of Earth, their distribution, circulation as well as their chemical and physical properties. • Included is study that describes visualization tools for an environmental observation and forecasting system for Columbia River [JCSB03].
19http://cs.swan.ac.uk/~csbob/ Earth Sciences: Hydrology Visualizing Spatial and Temporal Variability in Coastal Observatories by Jimenez et al [JCSB03] -system for modeling and evaluating effects of natural resource management decisions. CORIE (a coastal observatory) was designed as scalable, multi-use, real-time environmental and observational forecasting system (EOFS).
20http://cs.swan.ac.uk/~csbob/ Earth Sciences: Geology Geology: scientific study of Earth, its composition, structure and physical properties. Included in survey are contributions that visualize hot fluids discharges from sea floor vents [SBS∗ 04] and produce illustrative rendering of geologic layers [PGTG07], [PGT*08].
21http://cs.swan.ac.uk/~csbob/ Earth Sciences: Geology The Seismic Analyzer: Interpreting and Illustrating 2D Seismic Data, Patel et al, [PGT*08] -replace manual hand-drawn diagrams with automated visualization techniques
22http://cs.swan.ac.uk/~csbob/ End of Part II • Thank you for your attention! Any questions? We would like to thank the following: • M. Chen and all authors featured in the survey • The Research Institute for Visual and Interactive Computing (RIVIC) • PDF version of STAR available at: http://cs.swan.ac.uk/~csbob • Next up: Rick Walker and Part III