Download
1 / 35
350 likes | 501 Views
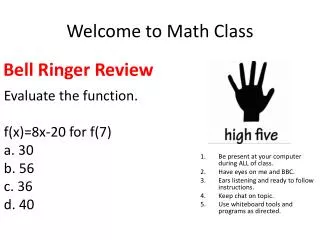
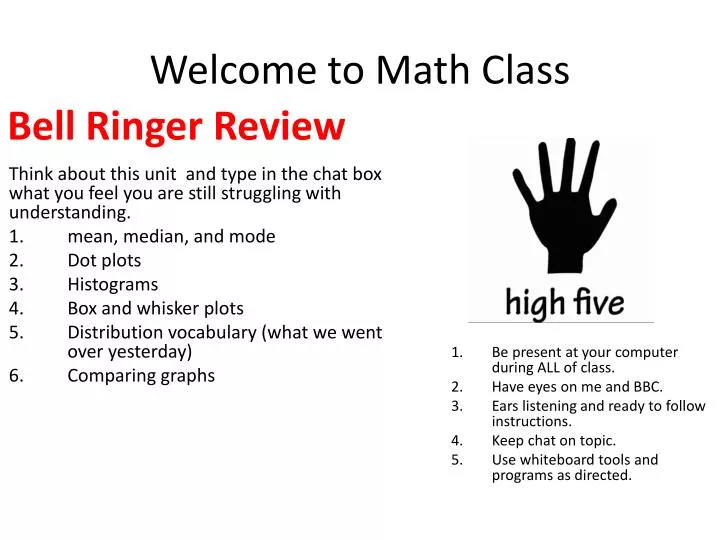
Bell Ringer Review. Welcome to Math Class. Think about this unit and type in the chat box what you feel you are still struggling with understanding. mean, median, and mode Dot plots Histograms Box and whisker plots Distribution vocabulary (what we went over yesterday) Comparing graphs .

E N D
Bell Ringer Review Welcome to Math Class Think about this unit and type in the chat box what you feel you are still struggling with understanding. • mean, median, and mode • Dot plots • Histograms • Box and whisker plots • Distribution vocabulary (what we went over yesterday) • Comparing graphs • Be present at your computer during ALL of class. • Have eyes on me and BBC. • Ears listening and ready to follow instructions. • Keep chat on topic. • Use whiteboard tools and programs as directed.
Objectives Content: I can find the mean, median, mode, and range of a list of numbers I can create and interpret dot plots and histograms I can create and interpret box and whisker plots given a set of data. I can interpret the shape of data plots. I can interpret and compare two data sets.
Vocabulary Match-Up! Mean Median Mode Range Standard Deviation Upper Quartile Lower Quartile Lower Extreme Upper Extreme Middle Amount between smallest and largest value How spread out data are Smallest number in a data set Number that appears the most Median of upper half of data Largest number in a data set Average Median of lower half of data
Sarah noticed that there are a lot of snowmen in the park near her house. She decides to see how her park compares to other parks nearby. She goes to each park and counts the number of snowmen. Her results are below:2, 6, 7, 1, 3, 4, 0, 5, 2, 2, 7, 9, 3, 2, 5, 1, 4, 4, 6, 0 What are the mean and median number of snowmen?
Check Understanding Give me an a-e. • A I don’t understand at all. • B I understand a little, but not very well • C I understand pretty well, but still make lots of mistakes • D I understand it how to do it, but couldn’t explain or help some one very well • E I completely understand and could help a classmate.
Sarah noticed that there are a lot of snowmen in the park near her house. She decides to see how her park compares to other parks nearby. She goes to each park and counts the number of snowmen. Her results are below:2, 6, 7, 1, 3, 4, 0, 5, 2, 2, 7, 9, 3, 2, 5, 1, 4, 4, 6, 0 Create a dot plot to represent the number of snowmen.
Check Understanding Give me an a-e. • A I don’t understand at all. • B I understand a little, but not very well • C I understand pretty well, but still make lots of mistakes • D I understand it how to do it, but couldn’t explain or help some one very well • E I completely understand and could help a classmate.
Sarah noticed that there are a lot of snowmen in the park near her house. She decides to see how her park compares to other parks nearby. She goes to each park and counts the number of snowmen. Her results are below:2, 6, 7, 1, 3, 4, 0, 5, 2, 2, 7, 9, 3, 2, 5, 1, 4, 4, 6, 0 Create a histogram to represent the number of snowmen.
Check Understanding Give me an a-e. • A I don’t understand at all. • B I understand a little, but not very well • C I understand pretty well, but still make lots of mistakes • D I understand it how to do it, but couldn’t explain or help some one very well • E I completely understand and could help a classmate.
Sarah noticed that there are a lot of snowmen in the park near her house. She decides to see how her park compares to other parks nearby. She goes to each park and counts the number of snowmen. Her results are below:2, 6, 7, 1, 3, 4, 0, 5, 2, 2, 7, 9, 3, 2, 5, 1, 4, 4, 6, 0 What is the mode of the data? What is the range of these data? What in this data set will give us clues about the size of the standard deviation? Compared to the range of the data, will the standard deviation be big, or small?
Check Understanding Give me an a-e. • A I don’t understand at all. • B I understand a little, but not very well • C I understand pretty well, but still make lots of mistakes • D I understand it how to do it, but couldn’t explain or help some one very well • E I completely understand and could help a classmate.
Create a box and whisker plot 11, 4, 11, 9, 13, 9, 8, 0, 8, 7, 11, 3, 8, 13
Create a box and whisker plot 6, 5, 7, 8, 9, 7, 7, 8, 6, 3, 7
Check Understanding Give me an a-e. • A I don’t understand at all. • B I understand a little, but not very well • C I understand pretty well, but still make lots of mistakes • D I understand it how to do it, but couldn’t explain or help some one very well • E I completely understand and could help a classmate.
Vocabulary Match-Up Take 2 Symmetric Uniform Bimodal Unimodal Skewed left Skewed right None
Check Understanding Give me an a-e. • A I don’t understand at all. • B I understand a little, but not very well • C I understand pretty well, but still make lots of mistakes • D I understand it how to do it, but couldn’t explain or help some one very well • E I completely understand and could help a classmate.
7. Using these two box plots showing the high temperature for the same two months in two different cities, answer the following questions. a. Which city has a smaller range of high temperatures? b. True or False: Fifty percent of the temperatures were the same for Provo and Salt Lake City. Explain your reasoning.
7. Using these two box plots showing the high temperature for the same two months in two different cities, answer the following questions. c. The lower 25% of the days are below what temperature in Provo? (Quartile 1) d. If you wanted to live in the colder city, which city would you choose and why?
Check Understanding Give me an a-e. • A I don’t understand at all. • B I understand a little, but not very well • C I understand pretty well, but still make lots of mistakes • D I understand it how to do it, but couldn’t explain or help some one very well • E I completely understand and could help a classmate.
Objectives Content: I can find the mean, median, mode, and range of a list of numbers I can create and interpret dot plots and histograms I can create and interpret box and whisker plots given a set of data. I can interpret the shape of data plots. I can interpret and compare two data sets.
What to do next: Today: Unit 2 Test You should have done: All of unit 2
Work on Assignments • Pick a breakout room that you need to complete still/need help on • Help each other out • If as a group you can’t figure it out, raise your hand and I’ll come help
Small Groups • If I call your name, please move yourself to the breakout room to work with me. • The rest of you stay here and work with Mrs. Reeder on a couple more examples. • The last 2 minutes, I will bring you all back to fill out the survey
Save participants list Save chat
Survey Survey link: http://tinyurl.com/UTVAHSATTD Recording: https://docs.google.com/forms/d/1nERQgUEDMWCoaOQuLk1nZ6RLFfNwLcmnuqysVcV7GhE/viewform Secret word: lemon