Download
1 / 45
470 likes | 716 Views
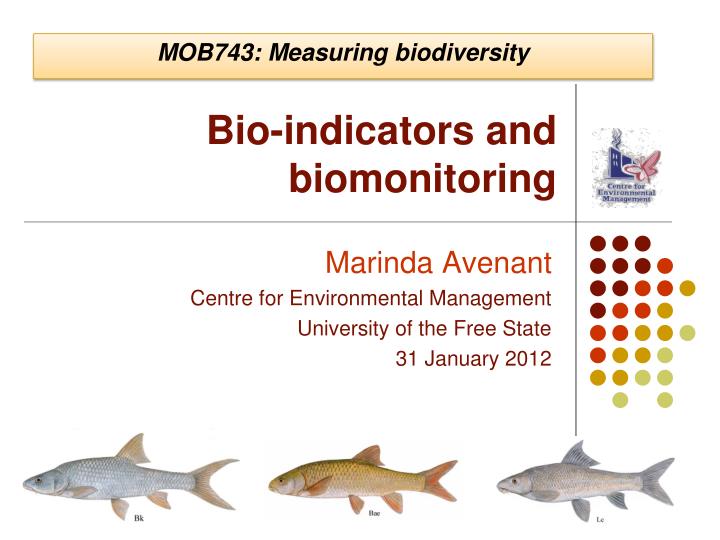
MOB743: Measuring biodiversity. Bio-indicators and biomonitoring. Marinda Avenant Centre for Environmental Management University of the Free State 31 January 2012. Biological monitoring.

E N D
MOB743: Measuring biodiversity Bio-indicators and biomonitoring Marinda Avenant Centre for Environmental Management University of the Free State 31 January 2012
Biological monitoring • The systematic use of biological responses (or ecological indicators) to measure and evaluate anthropogenic changesto the environment with the purpose of using this information in quality control programs. • The core principle of biomonitoring is to detect divergence from biological integrity (especially divergence attributable to human actions). (Karr, 1999).
Where has it all started? • Measuring biological integrity • 1900s • Quantitative indices • Indicator sp.; guilds; sp. Richness; sp. Diversity; similarity indices etc. • Clean Water Act of 1972 • Index of Biotic Integrity IBI (Karr et al., 1986) • Multi-metric index • Integrative ecological index that directly relates fish communities to other biotic and abiotic components of the ecosystem.
Where has it all started? • 1972 Clean Water Act (USA) mandated: “Protection of River health… restoring and maintaining the chemical, physical and biological integrity of the Nation’s waters”.
Where has it all started? • Measuring biological integrity • 1900s • Quantitative indices • Indicator sp.; guilds; sp. Richness; sp. Diversity; similarity indices etc. • Clean Water Act of 1972 • Index of Biotic Integrity IBI (Karr et al., 1986) • Multi-metric index • Integrative ecological index that directly relates fish communities to other biotic and abiotic components of the ecosystem.
Integration of land use impacts on drivers, habitats & biological responses Louw & Kleynhans, 2007
Where has it all started? • In South African context • SASS – Chutter (1972) • 1990s • FAII (Kleynhans, 1999) • FAII takes into account: • Relative intolerances of fish species • Frequency of occurrence • General health & well-being • FRAI; MIRAI; VEGRAI
Biomonitoring of water resources required by Law • National Water Act (1998) • Chapter 14 recognizes monitoring of water resource quality as an integral part of water resources management • National Water Resources Strategy (NWRS) • Need different monitoring systems to give a comprehensive expression of the state of the environment
Concepts of “River health” and “Ecological integrity”
“River Health” concept River health can be defined as the degree to which the three main physical & chemicalattributes of a river (its energy source, water quality and flow regime), plus its biota and their habitats, match the natural conditions at all scales. (Karr, 1991)
What is Ecological Integrity? The capability of an ecosystem to support and maintain a resilient community of organisms having a species composition, diversity, and functional organisation comparable to that of natural habitats in the region.( Adapted from Karr & Dudley, 1981). Ecological integrity = habitat integrity + biological integrity + physical-chemical integrity
Biological integrity Nothing alive Unhealthy Gradient of biological condition Healthy Pristine Gradient of human disturbance Sustainable Severe disturbance Not sustainable No disturbance Threshold Ecological integrity LOW ecological integrity HIGH ecological integrity (After Karr & Chu, 1999)
Can we determine ecological integrity? Biotic integrity can also be viewed as a measure of the degree to which the present biological conditionof a system has been modified relative to its natural state.
Natural state or reference condition • Condition with no or minimal anthropogenic stress. • In the absence of ecosystems in their “natural state” the concept of “best attainable” is relevant. • Reference state = benchmark
How do we determine reference conditions? • Locate the least impacted sites, either in the same river zone or in a river that is ecologically similar. • Use results of historical surveys before human impacts, or from ecological similar rivers. Use historical photographs and land cover data. • Expert knowledge. • “Ecoregions” • “Virtual ecosystems”
Present ecological state Conceptual model for assessing the ecological state of an ecosystem (cf. RHP)
Present ecological state (PES) • The current state of affairs! - How much does the current state differs from the natural state • Expressed in terms of the following components: • Physical integrity/Drivers • Geomorphology • Hydrology • Physico-chemical integrity • Biological integrity/response • Ecostatus • Integrated state
Unhealthy Biological integrity Healthy A Sustainable Not sustainable Threshold Ecological categories E D C B F
What do you need to assess the ecological integrity of an ecosystem? • Effective tools to measure the “health” of rivers at scales large enough to be useful for management. • These tools should be comprehensive, sensitive and quantitative tools (indicators) that are able to integrate and assess the conditions of each of the mentioned components (physical, chemical & biological) of an ecosystem.
Why are chemical analyses not enough? • The results reflect the conditions at the exact time of sampling. • It is impossible to measure all different chemical substances. • Some of the most toxic substances occur in minute quantities, often below detection limits (Day, 2000). Chemical measures cannot be assumed to reflect the health of biota.
“Integrators” of information Biological communities: • Reflect overall ecological integrity (chemical, physical & biological) • Integrate the effects of different stressors in the catchment – aggregate impact • Integrate the stresses over time & provide an ecological measure of fluctuating environmental conditions.
Predation Symbioses Population W Herbivory Competition Population Z Population Y Community Patterns Community Structure Community Processes Population X Community A
Patterns in community response to stress are used to determine biological integrity & ecological function
Ecological Indicators (Tools) The tools (indicators) used for assessing the complex variables that constitutes river health need to be: • Ecologically based • Efficient • Rapid • Consistently applicable in different regions
Ecological indicators (Tools) • Indicator species • Resident communities (e.g. fish, invertebrates) reflect (or integrate) chemical & physical impacts in a time-related manner, and are therefore regarded as good indicators of overall biological integrity.
Macro-invertebrates • Good indicators of localised conditions • Integrate effects of short-term env variations • Sampling relatively easy, requires few people and inexpensive gear • Minimal detrimental effect on resident biota. • Macro-invertebrates abundant in most streams.
Fish • Good indicators of long-term effects & broad habitat conditions • Fish assemblages represents various trophic levels. • Env requirements & life-history of (relatively) fish well-known
Interpretation of results obtained by means of biomonitoring. • The information obtained by biomonitoring should be simplified to be of use to resource managers, conservationists & the public. • A biological index integrates and summarises the biological data within an indicator group. • Biological indices therefore quantify the condition of river health with a numeric output.
The value of biomonitoring • Is it appropriate technology?
Biomonitoring is good for: • Surveillance of the general ecological state of aquatic systems • Assessment of impacts (before & after) • Audit of compliance with ecological objectives or regulatory standards • Detection of long-term trends in the environment
Biomonitoring is good for: • To integrate information… • To provide strong scientific support in the absence of a full understanding of properties and interactions of complex systems being assessed • As an element of environmental management and an NB method (tool) in determining the state of the aquatic environment.
To summarize: • Biomonitoring is used to track, evaluate and communicate change in the condition of living ecosystems as a result of human impacts. • Biomonitoring, therefore, identifies ecological risks that are NB to human health and well-being • The goal is not to document and understand ALL the variation that arises in natural systems. Limitations: Not useful as early warning system! Difficult to account for natural variables! Sampling labour intensive & time-consuming!
In conclusion: While science thrives on good questions, management needs GOOD ANSWERS, as quickly and cheaply as possible. It’s a trade-off between SPEED and ACCURACY