Download
1 / 66
680 likes | 935 Views
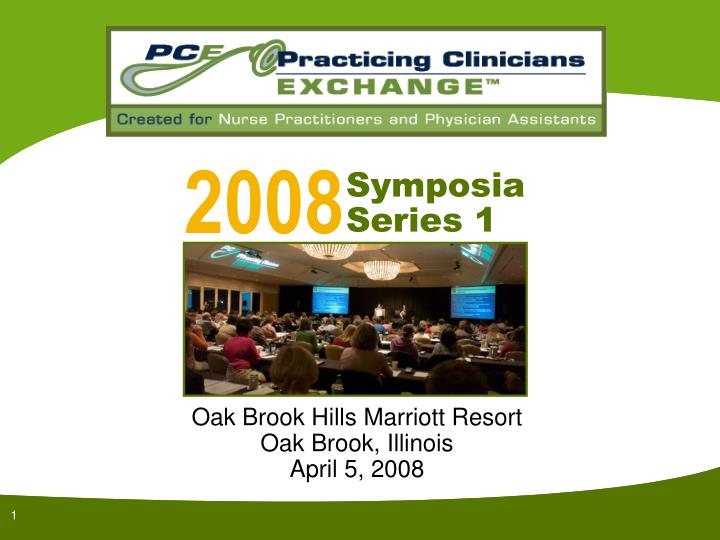
Oak Brook Hills Marriott Resort Oak Brook, Illinois April 5, 2008. 2008. Symposia Series 1. 1. 1. Dyslipidemia: When Statins Alone Fail. Elizabeth Schilling, MSN, CRNP Adult Nurse Practitioner Maryland Primary Care Physicians Stevensville, Maryland. 0.

E N D
Oak Brook Hills Marriott Resort Oak Brook, Illinois April 5, 2008 2008 Symposia Series 1 1 1
Dyslipidemia:When Statins Alone Fail Elizabeth Schilling, MSN, CRNP Adult Nurse Practitioner Maryland Primary Care Physicians Stevensville, Maryland
0 What percentage of your patients with dyslipidemia who are receiving statin therapy alone achieve their LDL-C goal? • ≤25% • 26%-50% • 51%-75% • 76%-100% Use your keypad to vote now! LDL-C = low-density lipoprotein cholesterol.
Faculty Disclosure • Ms Schilling has no relevant financial relationships with any commercial interests to disclose
Learning Objectives • Identify patients who would benefit from combination therapy for dyslipidemia based on results of recent clinical trials • Develop optimal treatment strategies for lowering LDL-C and raising HDL-C levels in patients with mixed dyslipidemia • Educate patients on the benefits and long-term safety data associated with combination drug therapy for dyslipidemia HDL-C = high-density lipoprotein cholesterol.
History and Physical Findings • 65-year-old white man • History of CABG surgery (1 year prior), hypertension • Physical findings • Height: 1.83 m (6 ft); weight: 107 kg (236 lb); waist circumference: 103 cm (40.6 in); BMI: 32 kg/m2 • BP: 118/78 mm Hg • Current medications • Ramipril (10 mg once daily) • Atorvastatin (20 mg once daily) BMI = body mass index; BP = blood pressure; CABG = coronary artery bypass graft.
Laboratory Results • Lipid profile • TC: 173 mg/dL • LDL-C: 80 mg/dL • Non–HDL-C: 136 mg/dL • HDL-C: 38 mg/dL • TG: 280 mg/dL • FPG level: 138 mg/dL (120 mg/dL at last visit) FPG = fasting plasma glucose; TC = total cholesterol; TG = triglyceride.
0 What is this patient’s CHD risk category? • Very high • High • Moderately high • Moderate • Low Use your keypad to vote now! CHD = coronary heart disease.
AHA/NHLBI 2005 Scientific Statement: The Metabolic Syndrome • Diagnosis is established by the presence of ≥3 risk factors *Lower cutpoints (≥90 cm in men and ≥80 cm in women) for Asian Americans. †Or drug treatment for elevated TG or glucose levels, hypertension, or reduced HDL-C levels. ACE = angiotensin-converting enzyme; AHA = American Heart Association; NHLBI = National Heart, Lung, and Blood Institute. Grundy SM, et al. Circulation. 2005;112;2735-2752.
NCEP ATP III 2004 Update: Risk Categories CVD = cardiovascular disease; NCEP ATP III = National Cholesterol Education Program Adult Treatment Panel III. Adapted from Grundy SM, et al. Circulation. 2004;110:227-239.
NCEP ATP III 2004 Update:LDL-C Goals and Cutpoints *In patients with moderate or higher risk, use therapy sufficient to achieve at least a 30%-40% reduction in LDL-C levels. TLC = therapeutic lifestyle changes. Adapted from Grundy SM, et al. Circulation. 2004;110:227-239.
0 What would be your next step in treating this patient? • Increase atorvastatin dose to 40 mg once daily • Add a glucose-lowering agent and a fibrate to his current atorvastatin regimen (20 mg once daily) • Add omega-3 fatty acids(3-4 g/d) to his current atorvastatin regimen (20 mg once daily) • Add extended-release niacin (1000 mg/d) to his current atorvastatin regimen (20 mg once daily) Use your keypad to vote now!
Treatment Decision (Option 1) What would be your next step in treating this patient? • Increase atorvastatin dose to 40 mg once daily • Add a glucose-lowering agent and a fibrate to his current atorvastatin regimen (20 mg once daily) • Add omega-3 fatty acids (3-4 g/d) to his current atorvastatin regimen (20 mg once daily) • Add extended-release niacin (1000 mg/d) to his current atorvastatin regimen (20 mg once daily)
Treatment Decision (Option 1) • Increasing the statin dose will lower LDL-C and non–HDL-C levels about 5%-6% but will have minimal effect on TG and HDL-C levels • This may have little benefit on his residual CHD risk
Residual CHD Risk in Major Statin Trials CHD events occur in patients treated with statins Placebo Statin 28.0 Patients Experiencing Major CHD Events (%) 19.4 15.9 13.2 11.8 12.3 10.2 10.9 7.9 8.7 6.8 5.5 4S1 LIPID2 CARE3 HPS4 WOSCOPS5 AFCAPS/ TexCAPS6 N 4444 9014 4159 20,536 6595 6605 LDL -35% -25% -28% -29% -26% -25% Secondary High Risk Primary 1. 4S Group. Lancet. 1994;344:1383-1389. 2. LIPID Study Group. N Engl J Med. 1998;339:1349-1357. 3. Sacks FM, et al. N Engl J Med. 1996;335:1001-1009. 4. HPS Collaborative Group. Lancet. 2002;360:7-22. 5. Shepherd J, et al. N Engl J Med. 1995;333:1301-1307. 6. Downs JR, et al. JAMA. 1998;279:1615-1622.
Residual CVD Risk in Patients Treated With Intensive Statin Therapy Statistically significant reductions, but significant residual CVD risk remains Intensive high-dose statin therapy Moderate statin therapy Patients Experiencing Major CVD Events (%) PROVE IT-TIMI 221 IDEAL2 TNT3 8888 10,001 4162 N 104 81 101 77 LDL-C* (mg/dL) 95 62 *Mean or median LDL-C after treatment. 1. Cannon CP, et al. N Engl J Med. 2004;350:1495-1504; 2. Pedersen TR, et al. JAMA. 2005;294:2437-2445; 3. LaRosa JC, et al. N Engl J Med. 2005;352:1425-1435.
Diminished Benefit of Lowering LDL-C Substantially Below 100 mg/dL in High-Risk Patients LDL-C Level (mg/dL) CV = cardiovascular; NNT = number needed to treat;; RRR = relative risk reduction. Adapted from Hayward RA, et al. Ann Intern Med. 2006;145:520-530.
Diminished Benefit of Lowering LDL-C Substantially Below 100 mg/dL in High-Risk Patients LDL-C Level (mg/dL) Adapted from Hayward RA, et al. Ann Intern Med. 2006;145:520-530.
Residual CVD Risk in Patients With Diabetes Treated With Statins HPS1: n = 5963* CARDS2: N = 2838 30 16 13.4 25.1 14 25 22% Risk Reduction 32% Risk Reduction 12 20.2 20 9.4 10 Major Vascular Event Rate (%) Acute CVD Event Rate (%) 15 8 Residual CVD Risk 6 Residual CVD Risk 10 4 5 2 0 0 Placebo Atorvastatin Placebo Simvastatin *Patients with diabetes. (HPS also enrolled 14,573 high-risk patients without diagnosed diabetes.) 1. Collins R, et al. Lancet. 2003;361:2005-2016; 2. Colhoun HM, et al. Lancet. 2004;364:685-696.
Patients With Diabetes Have Particularly High Residual CVD Risk After Statin Treatment MI = myocardial infarction; PTCA = percutaneous transluminal coronary angioplasty.
250 219 Controls 200 CHD 152 150 134 Plasma Lipid Concentration (mg/dL) 110 100 57 47 50 0 LDL-C TG HDL-C Lipids in Patients With Premature CHD Men Women * † 200 177 180 Controls 160 CHD 141 139 138 140 120 Plasma Lipid Concentration (mg/dL) 100 80 † 60 * 45 35 40 20 0 LDL-C TG HDL-C *P <.005 compared with controls. †P <.05 compared with controls. Genest JJ Jr, et al. Circulation. 1992;85:2025-2033.
0 Independent risk factors for CVD in patients with diabetes and the metabolic syndrome include: • Low TG levels and high LDL-C levels • Low TG levels and high HDL-C levels • High TG levels and low LDL-C levels • High TG levels and low HDL-C levels Use your keypad to vote now!
Atherogenic Dyslipidemia in Patients With Diabetes and the Metabolic Syndrome • High TG levels (independent CVD risk factor) • TG-rich remnant lipoproteins (VLDL) • Altered metabolism (lipolysis) of LDL and HDL particles • Absolute levels of LDL-C are commonly not significantly increased, but other LDL parameters significantly change • ↑ Number of LDL particles (↑ LDL-P and Apo B) • Predominantly small, dense LDL-P • Low levels of HDL-C (major independent CVD risk factor) • May reduce reverse cholesterol transport Apo B = apolipoprotein B; LDL-P = LDL particle; VLDL = very low-density lipoprotein. Garvey WT, et al. Diabetes. 2003;52:453-462; Haffner SM. Diabetes Care. 2003;26 (suppl 1):S83-S86.
TG Level Is Significant CVD Risk Factor: Recent Meta-Analysis of 29 Studies GroupsCHD Cases N = 262,525 Duration of follow-up ≥10 years 5902 <10 years 4256 Sex Male 7728 Female 1994 Fasting status Fasting 7484 Nonfasting 2674 Adjusted for HDL Yes 4469 No 5689 1.72 (1.56-1.90) *Individuals in top vs bottom third of usual log-TG values; adjusted for at least age, sex, smoking status, and lipid concentrations; also adjusted for BP (in most studies). 1 2 CHD Risk Ratio* (95% CI) Sarwar N, et al. Circulation. 2007;115:450-458.
<105 105-166 >166 TG Level (mg/dL) 3.2% 8.3% Coronary Event Rate 5.2% Risk of CHD by TG Level:PROCAM Study 8-Year Follow-Up N = 4639 men with no history of MI or stroke • Elevated TG levels significantly increase CHD risk • Significant correlation remains between TG level and CHD risk after adjustment for LDL-C and HDL-C • 6-fold increased CHD risk in patients with TG >200 mg/dL and LDL-C:HDL-C >5 P = .001 2.6 P = .01 1.6 Comparator 1.0 Relative CHD Risk Assmann G, et al. Am J Cardiol. 1996;77:1179-1184.
TG Level Remains CVD Risk Factor in Patients Treated With Statins: CARE and LIPID N = 13,173 Slope = .018 P = .02 Placebo Pravastatin CVD Event Rate (%)* Slope = .029 P <.001 <98 99-126 127-158 159-207 >207 TG Level (mg/dL) *CHD death, nonfatal MI, CABG, PTCA. Sacks FM, et al. Circulation. 2000;102:1893-1900.
NCEP ATP III: TG-Rich Remnant Lipoproteins Are Atherogenic • Elevated TG levels are a marker for elevated levels of atherogenic remnant lipoproteins • VLDL-C is the most readily available measure of atherogenic remnant lipoproteins for clinical practice • When TG levels are elevated, non–HDL-C (TC − HDL-C) better represents the concentrations of all atherogenic lipoproteins than LDL-C alone • Non–HDL-C should be a secondary target of therapy when TG levels are ≥200 mg/dL VLDL-C = very low-density lipoprotein cholesterol. NCEP ATP III. Circulation. 2002;106:3143-3421.
Non–HDL-C in Predicting CHD Risk • Within non–HDL-C levels, no association was found between LDL-C and the risk for CHD • In contrast, a strong positive and graded association between non–HDL-C and risk for CHD occurred within every level of LDL-C • Non–HDL-C is a stronger predictor of CHD risk than LDL-C Relative CHD Risk ≥190 160-189 <160 <130 130-159 ≥160 Non–HDL-C (mg/dL) LDL-C (mg/dL) Liu J, et al. Am J Cardiol. 2006;98:1363-1368.
NCEP ATP III: HDL-C Is an Independent Risk Factor for CHD • A low HDL-C level is strongly and inversely associated with CHD risk • Independent relationship holds after correction for other risk variables in multivariate analysis • A low HDL-C level often correlates with elevations of serum TG and remnant lipoproteins • HDL may be antiatherogenic • Promotes reverse cholesterol transport • Antioxidant and anti-inflammatory properties inhibit atherogenesis NCEP ATP III. Circulation. 2002;106:3143-3421.
Meta-Analysis: Predictive Value of HDL-C • Coronary Primary Prevention Trial (CPPT) • Multiple Risk Factor Intervention Trial (MRFIT) • Lipid Research Clinics Prevalence Mortality Follow-up Study (LRCS) • Framingham Heart Study (FHS) 1 mg/dL Increase in HDL-C CPPT MRFIT LRCS LRCS FHS FHS 2%CHDRisk in Men 3% CHD Risk in Women Gordon DJ, et al. Circulation. 1989;79:8-15.
Low HDL-C Increases CVD Risk Even if LDL-C Levels Are Well Controlled:TNT Study Patients with LDL-C ≤80 mg/dL on atorvastatin 80 mg (n = 4874) P <.0001 for inverse relationship Major CVD Events (%) ≤40 41-50 51-60 >60 *On-treatment level (3 months). HDL-C* (mg/dL) Barter P, et al. Poster presented at: American College of Cardiology 55th Annual Scientific Session; March 11-14, 2006; Atlanta, Ga. Abstract 914-203.
CVD Risk Associated With Low HDL-C Level Remains in Patients Treated With Statins Low HDL-C + statin High HDL-C + statin CVD Event Rate (%) CVD Event Rate (%) Sacks FM, et al. Circulation. 2000;102:1893-1900. HPS Collaborative Group. Lancet. 2002;360:7-22.
0 In patients with diabetes who receive statin therapy to reduce LDL-C levels: • Residual CVD risk remains high • Residual CVD risk is low • Residual CVD risk has no impact on event rates • Residual CVD risk from low HDL-C levels is not clinically significant Use your keypad to vote now!
Key Points • Residual CVD risk remains after patients are treated with statins to reduce LDL-C and is particularly high in patients with diabetes who are treated with statins • Atherogenic dyslipidemia contributes to residual risk for atherosclerosis and CVD risk • Increased levels of TG and TG-rich remnant lipoproteins • Increased levels of non–HDL-C • Increased numbers of Apo B–containing particles, including small, dense LDL • Decreased levels of HDL-C • The combination of high TG with low HDL-C and/or high LDL-C synergistically increases CHD risk
Treatment Decision (Option 2) What would be your next step in treating this patient? • Increase atorvastatin dose to 40 mg once daily • Add a glucose-lowering agent and a fibrate to his current atorvastatin regimen (20 mg once daily) • Add omega-3 fatty acids (3-4 g/d) to his current atorvastatin regimen (20 mg once daily) • Add extended-release niacin (1000 mg/d) to his current atorvastatin regimen (20 mg once daily)
Treatment Decision (Option 2): 3-Month Follow-up • Visit 1 • TLC (diet, exercise) reinforced • Glucose-lowering agent and fenofibrate (145 mg/d) prescribed as add-on to statin therapy • Visit 2 • Improvements in lipid profile and glucose level • No musculoskeletal side effects; no hepatic or renal laboratory abnormalities
Treatment Decision (Option 2): 3-Month Follow-up (cont’d) • After 3 months’ therapy with atorvastatin plus fenofibrate and a glucose-lowering agent
Treating Beyond LDL-C: Other Targets of Lipid-Lowering Therapy • Lipoproteins other than LDL are involved in atherogenesis (pro: VLDL, IDL; anti: HDL)1 • NCEP ATP III concluded (on the basis of several types of data) that an elevated non–HDL-C in patients with hypertriglyceridemia will impart increased risk even after the goal of LDL-C has been reached1 • NCEP ATP III 2004 update: “For those high-risk patients who have elevated triglycerides or low HDL-C levels, addition of a fibrate or nicotinic acid to LDL-lowering therapy can be considered.”2 IDL = intermediate-density lipoprotein. 1. Grundy SM. Circulation. 2002;106:2526-2529; 2. Grundy SM, et al. Circulation. 2004;110:227-239.
American Diabetes Association Standards of Medical Care in Diabetes:Dyslipidemia Management *An LDL-C goal <70 mg/dL is an option in patients with overt CVD. † An HDL-C goal >50 mg/dL should be considered for women. ‡ At high doses,niacin may increase blood glucose levels. American Diabetes Association. Diabetes Care. 2004;27:S68-S71. American Diabetes Association. Diabetes Care. 2007;30(suppl 1):S4-S41.
Lipid Management in Patients With Diabetes* or Metabolic Syndrome Statin therapy to achieve LDL-C <100 mg/dL (<70 mg/dL with CHD) TG ≥500 mg/dL Fibrate Omega-3 fatty acids TG ≥150-500 mg/dL Fibrate (with slightly low or normal HDL-C) Niacin (with very low HDL-C) TG <150 mg/dL and Niacin Low HDL-C† *Well-controlled diabetes; A1C <7.0%. †HDL-C <40 mg/dL in men or <50 mg/dL in women. Adapted from American Diabetes Association. Diabetes Care. 2004;27:S68-S71. Adapted from American Diabetes Association. Diabetes Care. 2007;30(suppl 1):S4-S41. Adapted from Physicians’ Desk Reference. 61st ed. Montvale, NJ: Thomson PDR; 2007:2725-2727.
Outcomes in Fibrate Trials: Patients With Diabetes or Metabolic Syndrome Major CVD Event Rate Trial N Control Drug RRR P Primary Prevention HHS1* 292 13.0% 3.9% 71% <.005 FIELD2† 7664 10.8% 8.9% 19% .004 Secondary Prevention BIP3‡ 1470 18.4% 14.1% 25% .03 VA-HIT4§ 769 29.4% 21.2% 32% .004 *Patients with TG >204 mg/dL and an LDL:HDL >5 (may or may not have had diabetes or metabolic syndrome). †Patients with diabetes and no prior CVD. ‡Patients with metabolic syndrome. §Patients with diabetes. 1Manninen V, et al. Circulation. 1992;85:37-45. 2Keech A, et al. Lancet. 2005;366:1849-1861. 3Tenenbaum A, et al. Arch Intern Med. 2005;165:1154-1160. 4Rubins HB, et al. Arch Intern Med. 2002;162:2597-2604.
VA-HIT: CVD Risk Reduction in Diabetics Compared With Nondiabetics Combined End Point Nonfatal MI CHD Death Stroke 0 5 3 P = .88 10 10 15 P = .67 Cumulative Event Rate Change (%) 18 20 22 21 P = .07 25 P = .09 P = .17 30 32 35 P = .004 DM 40 No DM 40 41 P = .26 45 P = .046 P = .02 DM = diabetes mellitus. Rubins HB, et al. Arch Intern Med. 2002;162:2597-2604.
FIELD: Primary and Secondary End Points 11% Reduction P = .035 Placebo Fenofibrate 21% Reduction P = .003 11% Reduction P = .16 24% Reduction P = .01 Event Rate (%) 19% Increase P = .22 Total CVD Events† (Secondary End Point) CHD Events* (Primary End Point) Nonfatal MI CHD Death Coronary Revascularization *Nonfatal MI and CHD death. †CHD events, stroke, CVD death, revascularizations. Keech A, et al. Lancet. 2005;366:1849-1861.
FIELD: End Points in Patients With No Prior CVD (78% of Study Population) CHD Events Total CVD (n = 7664) (n = 7664) 0 -5 -10 Risk Reduction (%) -15 -20 -19 P = .004 -25 Secondary End Point -25 P = .014 -30 Primary End Point Keech A, et al. Lancet. 2005;366:1849-1861.
Treatment Decision (Option 3) What would be your next step in treating this patient? • Increase atorvastatin dose to 40 mg once daily 2. Add a glucose-lowering agent and a fibrate to his current atorvastatin regimen (20 mg once daily) 3. Add omega-3 fatty acids (3-4 g/d) to his current atorvastatin regimen (20 mg once daily) 4. Add extended-release niacin (1000 mg/d) to his current atorvastatin regimen (20 mg once daily)
Treatment Decision (Option 3) • Prescription omega-3 fatty acids at 3-4 g/d are indicated for patients with severe hypertriglyceridemia (TG >500 mg/dL) • This reduces TG up to 40%, but there is little change in HDL-C levels, and LDL-C levels may increase
LDL-C HDL-C VLDL-C TG Efficacy of Omega-3 Fatty Acids for Patients With Severe Hypertriglyceridemia* † Placebo Omega-3 fatty acids 4 g † Change From Baseline (%) † † *TG level: 500-2000 mg/dL, N = 42. †P <.02 vs placebo. Harris WS, et al. J Cardiovasc Risk. 1997;4:385-391.
Omega-3 Fatty Acids/Statin Combination Therapy in Insulin-Resistant Obese Men Atorvastatin 40 mg * Omega-3 fatty acids 4 g Combination Change From Baseline (%) * * * * * * * LDL-C Non–HDL-C HDL-C TG Insulin Resistance (HOMA Score) N = 48 *P <.05 vs placebo. HOMA = homeostasis model assessment. Chan DC, et al. Diabetes. 2002;51:2377-2386.
Dietary Supplementation With Omega-3 Fatty Acids After MI GISSI-P Results Placebo (n = 2828) Omega-3 fatty acids 1 g (n = 2836) 15% Reduction P = .023 20% Reduction P = .008 Event Rate (%) Death/ Nonfatal MI/ Nonfatal Stroke CVD Death/ Nonfatal MI/ Nonfatal Stroke GISSI-P Investigators. Lancet. 1999;354:447-455.