Download
1 / 50
510 likes | 763 Views
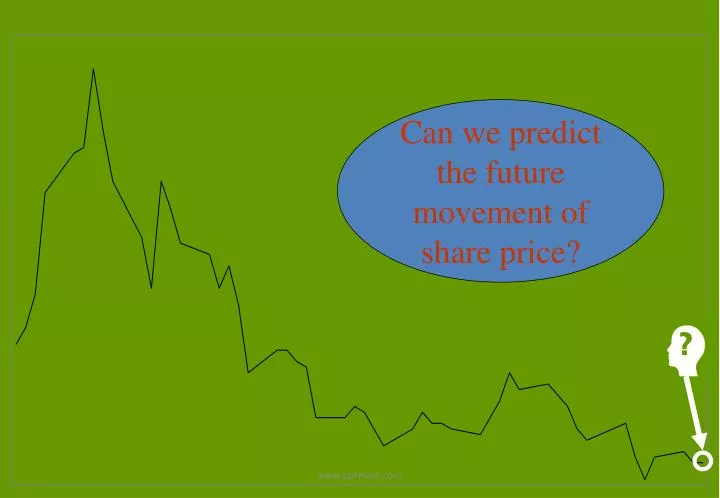
Can we predict the future movement of share price?. WHAT NEXT?. Frustrated???!!!. LIKE TO TRY ONCE MORE???. Can you say something about future share price?. WHAT NEXT?. Still Frustrated???!!!. WINNER. You can still think to be a winner but you have to learn Technical Analysis ….

E N D
Can we predict the future movement of share price? www.pptmart.com
WHAT NEXT? www.pptmart.com
Frustrated???!!! www.pptmart.com
LIKE TO TRY ONCE MORE??? www.pptmart.com
Can you say something about future share price? www.pptmart.com
WHAT NEXT? www.pptmart.com
Still Frustrated???!!! www.pptmart.com
WINNER You can still think to be a winner butyou have to learn Technical Analysis … www.pptmart.com
Food for thought … • “If terms like intrinsic business value, value investing, margin of safety, PE ratio, PEG ratio makes you go blank… • If you cannot infer the impact of political risk, country risk, inflation risk, exchange risk on your company performance… • If you feel shivers investing in ONGC at 1200 levels or for that matter at 950 levels in RIL or at 480 levels in Maruti… www.pptmart.com
Food for thought … • If you think that you will only earn in good growth companies over a period of time by ‘invest and sleep philosophy’… • If you feel boredom will win the battle when you have to study balance sheets of companies… • If you are a science or an arts graduate and you had a wish in mind that if you would have taken commerce than you could be in the league of Rakesh Jhunjhunwala… • Then, Technical Analysis is the only answer” www.pptmart.com
Ashwani Gujral Deepak Mohoni Vijay Bhambwani Dharmesh Pancholi Vidur Pendharkar Mathew Easow Salil Sharma Rajat Bose Hardik Jain Prakash Gaba Hitendra Vasudeo Mukesh Singh Join the club of … you are most welcomeLeading Technical Analysts of India … www.pptmart.com
TECHNICAL ANALYSIS Dr. C. P. Gupta www.pptmart.com
Technical Analysis deals in probabilities; never certainties. Before we proceed, … Remember the following important quote: FIRST THING!!! www.pptmart.com
SECOND THING!!! Remember the LESSON, we learn from the following: Economic Times – April 26, 2005 www.pptmart.com
Thoughtful and successful technical analysts admit that continued success is dependent upon keeping successful strategies known only to a few. THIRD THING!!! Remember the secret behind the success of Technical Analysis: www.pptmart.com
TECHNICAL ANALYSIS …??? • “… attempts to predict future share prices by analysing past share prices.” • “The art of technical analysis is to identify trend changes at an early stage and to maintain an investment posture until the weight of the evidence indicates that the trend has reversed.” • “… an analysis of past volume and/or price behaviour to identify which shares to purchase/sell and the best time to purchase/sell them.” www.pptmart.com
TECHNICAL ANALYSIS …???(continued…) • “… an analysis that includes the use of “market generated data” so that a TECHNICIAN can formulate rules regarding - • when to buy a share or • when to sell a share. “ www.pptmart.com
PREMISES OF TECHNICAL ANALYSIS • MARKET ACTION DISCOUNTS EVERYTHING. • The premise accepts in a way NEWTON’S FIRST PRINCIPLE OF MOTION - everything will continue in its state of rest or motion unless it is acted upon by another external force. • MARKET PRICE IS SOLELY DETERMINED BY THE INTERACTION OF THE FORCES OF DEMAND AND SUPPLY. • DEMAND AND SUPPLY ARE DETERMINED BY BOTH - RATIONAL AS WELL AS IRRATIONAL FACTORS. • PRICES HAVE A TENDENCY TO MOVE IN TRENDS THAT PERSISTS FOR APPRECIABLE LENGTH OF TIME. • REVERSALS OF TRENDS ARE CAUSED BY SHIFTS IN DEMAND AND SUPPLY.
PREMISES OF TECHNICAL ANALYSIS(continued…) • SHIFTS IN DEMAND AND SUPPLY CAN BE DETECTED SOONER OR LATER IN CHARTS OR GRAPHS. • HISTORY REPEATS ITSELF AND PEOPLE DO NOT LEARN FROM THE HISTORY. • THERE IS A TIME-GAP BETWEEN THE TIME A TECHNICIAN PERCEIVES A CHANGE IN THE PRICE OF A SECURITY AND WHEN THE INVESTING PUBLIC ASSESSES THE CHANGE. • THE PERSON CONCERNED IN THE MARKET IS A TRADER AND NOT AN INVESTOR. • THE APPROACH OF TECHNICAL ANALYSIS IS TO ‘ANTICIPATE THE PRICE’ AS OPPOSE TO ‘INTRINSIC VALUE’ APPROACH TO SECURITY VALUATION. www.pptmart.com
PROCESS OF TECHNICAL ANALYSIS - CHARTISTS APPROACH Take Prices and Volume data Draw graph and charts Identify trends Bind the trends Find changes, variations and momentum Market indicators www.pptmart.com
TOOLS OF TECHNICAL ANALYSIS • CHARTS AND GRAPHS • Line charts : with ordinary scale and with logarithmic scale • Bar charts • Candle Chart • Point and Figure charts • Price charts • Volume charts • Rate of Change charts • PATTERNS • THE DOW THEORY • MEASURES • Moving averages • Momentum and oscillators • Breadth • THE MARKET INDICATORS • Investors’ sentiments • Contrary opinion • Professional investors behaviour • Economic data • Other www.pptmart.com
THE DOW THEORY • Oldest but still the most popular technical - technique. • Basically a CHARTING approach and was founded by CHARLES H. DOW,a co-founder of the Dow Jones Company and an editor of the Dow Jones owned newspaper - The Wall Street Journal. • FEATURES OF THE THEORY • It is absolutely technical in nature in the sense that it is built upon and concerned with only market data or market actions. • It is a chartist approach. • It assumes that the majority of shares follow the underlying trend of the market most of the time. In order to measure “the market”, two indices are used - one is INDUSTRIAL AVERAGE which is a combination of some blue-chip shares from industry and another is TRANSPORTATION AVERAGE which consists of shares of transport companies. The purpose of the second average is to reinforce the conclusions obtained from that of Industrial Average. www.pptmart.com
THE DOW THEORY(continued…) • It assumes that a trend should continue in effect until such time as its reversal has been definitely signaled. • It assumes that the securities of the most established companies tended to go up or down in prices together. • It believes that averages discounts everything. • It intends to show the general trend/direction of the market as a whole and does not predict the direction of change in a particular security. www.pptmart.com
THE DOW THEORY - THE BASIC PRINCIPLES • The Dow Theory believes that the market moves in swings or moves which show some pattern. • To make forecast and predictions, the Dow Theory identifies the following three movements which depict underlying trends and patterns: • MAJOR/PRIMARY TRENDS • first and the most important trend • broad and overall trend that lasts for few years • are usually caused by business cycles and intrinsic value of a security • long term investors are usually concerned with it • such trends are either BULLISH or BEARISH and they reflect the long-run direction of the market. www.pptmart.com
THE DOW THEORY - THE BASIC PRINCIPLES (Continued…) • SECONDARY TRENDS • are important reactions that interrupt the progress of prices in primary trends/directions • are intermediary reactions to primary trends • such trends usually last for several months • such trends are contrary to primary trends • such trends when set in may give wrong signals and may confuse the market • not of much importance to long term investors but may be important to weak holders • During a phase of UPWARD PRIMARY TREND, when prices decline temporarily, it is called TECHNICAL REACTION. • During a phase of DOWNWARD PRIMARY TREND, when prices rise temporarily, it is called TECHNICAL RALLY. • TECHNICAL REACTION and TECHNICAL RALLY are together called TECHNICAL CORRECTIONS. • Such trends are eliminated by correction that is reversion back to primary trend. www.pptmart.com
THE DOW THEORY - THE BASIC PRINCIPLES (Continued…) • MINOR/TERTIARY TRENDS • are brief,daily, narrow or day-to-day movements in the security prices • are of mainly random nature • not of much use to technical analysts except these are building blocks to secondary trends • The principle of confirmation of trends/change in trends : Whatever the trends that are emerging or changing in Industrial Average must be confirmed by Transportation Average. • If trends in share prices are in contradiction with the trends in the industrial production or transportation of goods, then one should not design a trading strategy in shares and must wait till one gets the confirmation of trends. www.pptmart.com
THE DOW THEORY - THE BASIC PRINCIPLES (Continued…) • Lines indicate movement. In Dow Theory, a line is defined as “a price movement two to three weeks or longer, during which the price variation of both averages moves within a range of approximately 5% of their mean averages. Such a movement indicates either accumulation or distribution.” • an advance above the limits of the “line” indicates accumulation and predicts higher prices (shares moving into strong and knowledgeable hands and therefore, bullish). • an advance below the limits of the “line” indicates distribution and predicts lower prices (shares moving into weak hands and therefore, bearish). • When a line occurs in the middle of a primary advance, it is really forming a horizontal secondary movement and should be treated as such.
THE DOW THEORY - THE BASIC PRINCIPLES (Continued…) • Price/Volume relationships provide background. Volume is considered as the FUEL required to move prices up and down. The normal relationship is for volume to expand on rallies and contract on decline. If volume becomes dull on a price advance and expands on a decline, a warning is given that the prevailing trend may soon be reversed. However, it should used only as background information since actual reversals would be signaled by the averages. • Price action determines the trend. • Bullish indications are given when successive rallies penetrates peaks while the trough of an intervening decline is above the preceding trough. • Bearish trends indications come from a series of declining peaks and troughs. www.pptmart.com
AVERAGES DISCOUNT EVERYTHING!!!! • Moving Averages • Simple Moving Average • Weighted Moving Average • Exponential Moving Average Averages are basically to identify the underlying TRENDS!!!!! www.pptmart.com
EXPONENTIAL MOVING AVERAGE • EMAt = EMAt-1 + a[Pt - EMAt-1] • Suggested value of a for EMA: No. of Weeks a 5 0.40 10 0.20 20 0.10 40 0.05 80 0.025 Usually, it is calculated as 2/(number of weeks) www.pptmart.com
TRENDS HAVE TO BE BOUNDED!!! • TREND CHANNELS -these are created by drawing two parallel lines. First line is one that represents the ‘basic trend’ and is known as BASIC TRENDLINE. And, the second line, parallel to it, is called RETURN TRENDLINE. • The RETURN TRENDLINE is useful from two points of view- • first, it represents area of SUPPORT or RESISTANCE depending upon the direction of underlying trend; and • second, penetration of the return trendline represents a signal that either the trend will accelerate or a reversal is about to take place. • ENVELOPS -these are created by drawing two symmetrical parallel lines to a moving average. This is based on the principle that share prices fluctuate around a given trend in cyclical movements. Envelops consists of the points of maximum and minimum divergence from some moving average. BOLLINGER BANDS are envelops plotted as some standard deviation above and below an average usually based on closing prices. www.pptmart.com
PRICES HAVE MOMENTUM!!!! • Momentum/oscilliator measures the velocity of the price move. • Rate of Change • Moving Average Convergence Divergence [MACD] • Relative Strength Index (RSI) • Stochastic: • %K • %D • Williams %R www.pptmart.com
MACD trading method is a form of trend-deviation indicator using two EMAs. • MACD = Difference between two EMAs or a ratio. If it is a ratio then it is obtained by dividing the shorter duration EMA by the longer duration one. • MACD can be further smoothed by calculating another EMA; and plotted as a separate line. Such a line is called SIGNAL LINE. www.pptmart.com
Relative Strength Index • RSI = 100 - (100/(1+RS)) where RS = (Average of x day’s up closes/ Average of x day’s down closes) • If RSI is over 70 then it is called the OVERBOUGHT ZONE and if RSI is below 30 then it is called the OVERSOLD ZONE. www.pptmart.com
STOCHASTIC • % K = 100 (C - L14) / (H14 - L14) • % D = A 3-PERIOD MOVING AVERAGE OF %K. • %D is a smooth version of %K. %K is usually plotted as a solid line while %D is a dotted line. • Williams %R = 100 (H14 - C) / (H14 - L14) www.pptmart.com
THE MARKET INDICATORS… • Investors’ sentiments • Such indicators try to indicate the DEGREE OF INVESTORS’ CONFIDENCE in the market. They usually gauge confidence by one of two general approaches: • one is to compare yields on risky securities to yields on less risky securities; • another is to measure confidence by indicating the WIDTH of a market change across all securities. [A] BARRON’S CONFIDENCE INDEX : A ratio between Yield on best graded bonds and yield on intermediate graded bonds. www.pptmart.com
THE MARKET INDICATORS…(continued…) • SHARE MARKETS HAVE BREADTH!!!! [B] High-Low Index : measures market strength and thereby market confidence by comparing the number of shares making ANNUALNEW HIGHS and number of shares making ANNUAL NEW LOWS. It is a ratio between number of shares with annual new highs to (number of shares with annual new highs + number of shares with annual new lows) [C] Advance-Decline Ratio : the market indices in general indicates whether the market on average is rising or falling but does not provide the breadth of the market. ADR gauge this market breadth by defining a ratio of number of advances to (number of advances + number of declines). [D] SHORT INTEREST RATIO : Short interest is defined as number of shares sold short and this ratio is number of shares sold short to average daily volume. www.pptmart.com
THE MARKET INDICATORS…(continued…) • MEASURES OF CONTRARY OPINION • The basic premise of this theory is that there are certain groups in the market who make consistently wrong decisions especially at the turns in the market. Find the decisions made by them and then, do THE OPPOSITE in the market. [A] THE ODD-LOT THEORY : Usually, odd-lot transactions are undertaken by small investors who are not having access to necessary information and they are not intelligent investors. Thus, if they sell more, it is a BUY signal and if they buy, it is a SELL signal. The following are usually used indicators in this regard: • Odd - Lot Balance Index • Odd - Lot Short Sales Index [B] MUTUAL FUND LIQUID ASSET RATIO : it is a ratio between Mutual Funds’ liquid assets and total Mutual Funds’ assets. www.pptmart.com
THAT'S ALL ABOUT TECHNICAL ANALYSIS www.pptmart.com