Download
1 / 21
250 likes | 618 Views
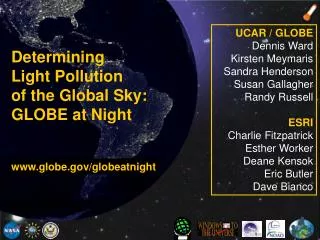
UCAR / GLOBE Dennis Ward Kirsten Meymaris Sandra Henderson Susan Gallagher Randy Russell ESRI Charlie Fitzpatrick Esther Worker Deane Kensok Eric Butler Dave Bianco. Determining Light Pollution of the Global Sky: GLOBE at Night. www.globe.gov/globeatnight. Overview of GLOBE

E N D
UCAR / GLOBE Dennis Ward Kirsten Meymaris Sandra Henderson Susan Gallagher Randy Russell ESRI Charlie Fitzpatrick Esther Worker Deane Kensok Eric Butler Dave Bianco Determining Light Pollution of the Global Sky: GLOBE at Night www.globe.gov/globeatnight
Overview of GLOBE • GLOBE at Night • Event/Activity • GIS / ArcExplorer • Results • Lessons Learned • 2007 GLOBE at Night GLOBE at Night www.globe.gov/globeatnight
International Programin 100+ countries Students collaboratewith scientists Hands-on science Atmosphere/ClimateHydrology Soil Land Cover/Biology Phenology Over 14 million environmental measurements taken
Get Out and Observe the Night Sky! March 22 – 31, 2006 GLOBE at Night Engage students worldwide in observing the nighttime sky Encourage citizen and family science with a hands-on learning activity outside of the classroom www.globe.gov/globeatnight Gather light pollution data from an international perspective
GLOBE at Night GLOBE at Night Web site • General information (downloadable) • Activity packets • English and Spanish • Teachers and Parent Versions • Star Magnitude Charts (by latitude bands) • Interactives • Light Pollution • Finding Orion • Observation Practice • Data Entry • Online Mapping using ArcExplorer Web www.globe.gov/globeatnight
GLOBE at Night Getting the word out UCAR and NOAO press releases Geography Network front page List servs and mass mailings Web sites Print media Local broadcast media Many local papers NY Times Science Observatory Scientific American Podcast Earth Science Picture of the Day
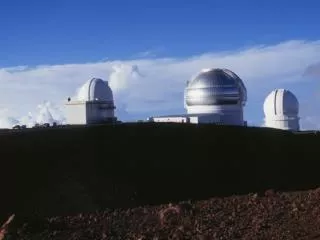
Local Kick-off Event Star Party at NCAR’s Mesa Lab
GLOBE at Night The Event • Over 18,084 people participated • From 96 countries on six continents • From all 50 U.S. States • 4591 observations reported • Averaged 9100 Web site hits a day • Over 760 people on mailing list • Additional information: • Of people reporting data: • 399 under 12 years old • 949 between 12-14 years old • 871 between 15-18 years old • Teacher feedback: • %71 Announced in class • %63 Handed out to students (3530 copies!) • %24 Recruited science/other school clubs • %31 Shared with other teachers • %17 Contacted local media to publicize
GLOBE at Night What Do the GLOBE at Night Data Tell Us? Darker skies – lower population density Brighter skies – higher population density “The GLOBE at Night data shows brighter skies in areas with more people. By submitting your observations to GLOBE at Night, you made an important contribution to science. You have provided valuable information that would have otherwise been impossible to obtain!”
GLOBE at Night Mapping The Results The data sets are available for download in shapefile, .xls, & .csv formats on theGaN website. They are also available online at GeographyNetwork.com Brighter dots – higher population density
GLOBE at Night Summary Analysis (3 pages) Exploration Guide (12 pages) Analyzing The Results These two analysis guides were published after the 2006 campaign. Both are written for middle and high school students.
North and Central America Summary Analysis of 2006 GLOBE at Night
Europe Summary Analysis of 2006 GLOBE at Night
Africa Summary Analysis of 2006 GLOBE at Night
Asia Summary Analysis of 2006 GLOBE at Night
Oceania Summary Analysis of 2006 GLOBE at Night
South America Summary Analysis of 2006 GLOBE at Night
Denver Area Summary Analysis of 2006 GLOBE at Night
GLOBE at Night What Have We Learned? • Immediate lat/long verification during online reporting • More explanation/accommodations for higher latitudes • Addition of cloud cover estimate • Suggestions to engage schools and large groups • Get the word out earlier to capture print media Join us next year:March 8th-21st, 2007
GLOBE at Night March 8th-21st, 2007 dward@ucar.edu