Download
1 / 28
330 likes | 758 Views
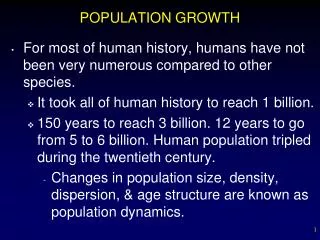
A crowded world. Trends in Human Population Growth. GROWTH in the World's Population. 1830 the world's population reached ONE BILLION 1930, just 100 years later the population reached 2 billion. 1960 (30 years later) it reached 3 billion 15 more years later in 1975, it climbed to 4 billion.12 years later in 1987, it crossed the 5 billion mark. 12 years later in 1999 the world's reached 6 billion By 2029, the world's population is estimated to be 10.4 billion.

E N D
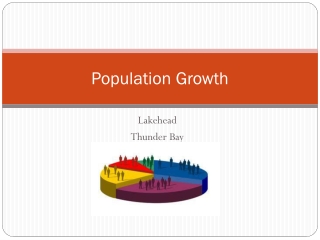
1. Global Population Growth What are the trends in global population growth?
Where are the people? How do these trends come about?
What is the relationship between population, the life course, and the character of industrial societies?
What do these population changes mean for the way we live our lives?�
3. Trends in Human Population Growth
4. GROWTH in the World�s Population 1830 the world�s population reached ONE BILLION
1930, just 100 years later the population reached 2 billion.
1960 (30 years later) it reached 3 billion
15 more years later in 1975, it climbed to 4 billion.
12 years later in 1987, it crossed the 5 billion mark.
12 years later in 1999 the world�s reached 6 billion
By 2029, the world�s population is estimated to be 10.4 billion
5. Population Growth � A graph
6. Population Growth: developed and developing countries
7. How rapidly is the global population adding a billion?
8. Distribution of population growth rates
9. Rate of change in the growth of the world�s population
10. Changes in the rate and absolute growths in the global population As the figure shows, the rate at which the global population is growing is slowing faster than the absolute increases in the population.
Can you explain why?
11. Distribution of World�s Population East Asia: Eastern parts of China, Japan, the Korean Peninsula and the island of Taiwan = 25% of World�s Population
South Asia: India, Pakistan, Bangladesh, and Sri Lanka 20% of World�s population.
South East Asia: Islands in the Pacific and Indian Oceans Indonesia, Philippines etc 500 million people
Europe = 15% of the World�s People
North America = Southern Canada & N.E USA has over 150 million people
Sparsely populated Areas include � Deserts, Very cold Lands (Arctic & Antarctic regions) and Forest Jungles.
12. Distribution of World�s People
13. Continental distribution of global population in 2002 Asia = 57%
Europe = 16%
Africa = 12%
South America = 9%
North America = 5%
Australia = 1%
14. Distribution of the world�s population 1800 � 2050. www.prob.org/...population...growth...growth.htm
15. World distribution of population by Latitude
16. Future increases in population
17. Thomas Malthus (a British Economist) & his 1798 essay on Population and Resources
18. Malthusian Theory on Population Thomas Malthus, wrote in 1798 that: Population was increasing geometrically but resource supplies were increasing arithmetically. He predicted that eventually, population growth will outstrip the supply of resources and If population growth is not controlled voluntarily, calamities (starvation, diseases, wars) will bring population in balance with the supply of resources.
19. THE DEOMGRAPHIC TRANSITION THEORY
20. Changes in Birth and Death rates during a demographic transition Stage 1 � Pre-industrial Stage
Agriculture leads to population increase and death rate fluctuates due to epidemics
Stage 2 � Early Industrial Stage
Improved agriculture expands population but improvement in nutrition lowers death rate
Stage 3 � Industrial Stage
Education and opportunities for jobs causes decline in fertility to match declines in death rates
Stage 4 � Post-industrial Stage
Low birth and death rates but birth rates might fluctuate at times
21. Why developing countries today cannot take advantage of a demographic transition? Lack of trained and skilled personnel (brain drain).
Lack of an essential energy base (coal, oil) to provide the energy for development.
Rapid population growth and poverty creates a poverty trap and no savings.
Lack of financial resources for investment in building factories and industries
Strong competition from already industrialized countries
22. What account for variations in Fertility levels of females from different societies�1? The absence of old age social security payments necessitate more child birth
High Infant mortality compels parents to have more children
Society�s view of children i.e. as a prestige
Educational opportunities for women
Carrier (job) opportunities for women
Religious beliefs (Catholics vrs. Muslims)
Availability and affordable of family planning and birth control services
23. What account for variations in Fertility levels of females from different societies�2? Level of affluence in the society
Cost of educating and raising children
Average age at marriage
Urbanization and associated high standard of living
Availability and affordable legal abortions for women
24. A diagram of the age structure of a population is called the Population Pyramid.
The Pyramid records the proportion (%) of the total population available in five-year age groups usually known as cohorts.
Constructing a Populating Pyramid
1. Look for a census data which divides the total population of a country into males and females and also into 5-year age groups (cohorts). Age structure of a country�s population
25. Classify the population of each sex group (males & females) into 5 year age group intervals (0-4. 5-9, 10-14 etc. to 85+.).
Calculate the percentage of the total population represented by each of the 5 year age groups for a) males and b) females.
Graph the percentage of the 5-year age groups for Males on the Left side of the vertical axis of a graph sheet and that for Females on the Right. Age structure of a country�s population �2
26. Dependent and Productive Populations The pre-productive age = between 0-14yrs,
Reproductive age = 15 - 44 years and�
Post-reproductive age = 45 - 85+
Economic Divisions
A) 0-18 = Dependent class
B) 65 years plus = Dependent class
C) 18-65 years = the Productive class
Age Dependency Ratio: P0-14 + P65+ X 100
P 15-64
27. Types of population pyramids 1. Nigeria - rapidly growing population, broad-base
2. Australia � stable population
3. Bulgaria � declining population, narrow-base
28. What is the relevance of the age-structure diagram?
Shows the occupational structure of a nation�s population
Displays the number of males to females (sex ratio) in the population
Provides clues to present and future trends in the growth of the population
Provides evidence of historical events that impacted the population (wars, economic booms etc).
29. Addressing the population problem � INDIRECT methods Education and empowerment of women
More women in the labor force
Improvements in health and economic conditions
Incentives for increasing or decreasing births
State laws setting limits on child births e.g. China.
30. Addressing the population growth problem � DIRECT methods Abstinence
Family planning & birth control services
Legal abortion
Legal migration (immigration and emigration)
Religious beliefs (e.g. catholic)