Download
1 / 50
520 likes | 1.74k Views
Chapter Outline. 6.1 Insurance Costs and Fair Premiums 6.2 Expected Claim Costs Homogeneous buyers Heterogeneous buyers Competition, Risk Classification, and Societal Welfare Redistributive Effects of Classification Behavioral Effects of Classification Classification Costs

E N D
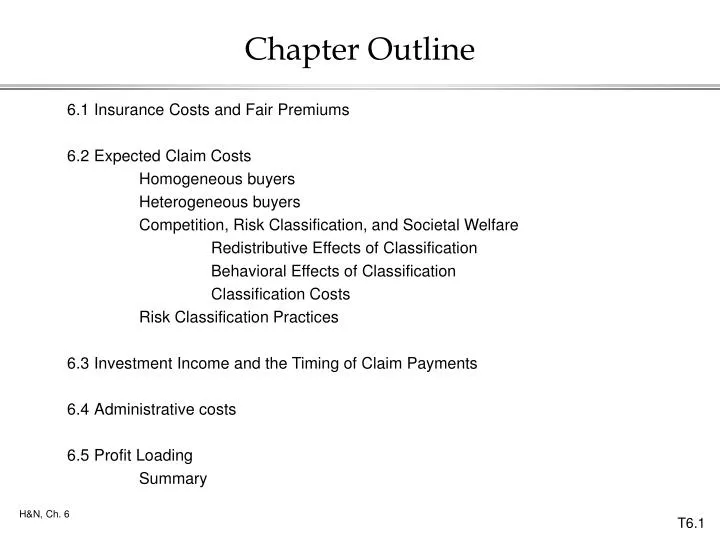
Chapter Outline 6.1 Insurance Costs and Fair Premiums 6.2 Expected Claim Costs Homogeneous buyers Heterogeneous buyers Competition, Risk Classification, and Societal Welfare Redistributive Effects of Classification Behavioral Effects of Classification Classification Costs Risk Classification Practices 6.3 Investment Income and the Timing of Claim Payments 6.4 Administrative costs 6.5 Profit Loading Summary
Chapter Outline 6.6 Capital Shocks and Underwriting Cycles Fair Premiums are Forward Looking Large Losses And Capital Shocks The Underwriting Cycle 6.7 Price Regulation Regulation Of Rate Changes Why Regulate Rate Changes? Effects of Regulating Rate Changes Regulation of Rating Factors Incentives for Risk Control Fairness, Imperfect Classification, and Control/Causality Issues Excessive Classification and Use of Subjective Assessments Ensuring Availability When Regulation Depresses Rates 6.8 Summary
Insurance Pricing • Objective: • Find the premium that equals expected costs, including a fair return to capital • known as the Fair Premium • It would prevail in a competitive market
Determinants of Fair Premiums • 4 Determinants • Expected Claim Costs • Administrative Costs • Investment Income • Fair Profit Loading • Examine each factor separately
Expected Claim Costs • The premium that just covers expected claim costs is called the pure premium • Example: • Large number of homogeneous buyers, i.e. each has the same loss distribution: Possible LossProbability $0 0.95 $10,000 0.05 • Pure Premium = $500
Assumption About Uncertainty • Actual average claim cost can differ from expected claim costs, but for now we will ignore this uncertainty
Premium Must Cover Expected Claim Costs • To cover claim costs, on average, premiums must equal $500. • if premium = $480, the insurer will lose money, on average • if premium = $640, the insurer will make profits, on average (competition would prevent this) • Conclusion: • Fair Premium must cover expected claim costs
Implications of Heterogeneous Buyers • What if there are two groups of buyers? • One Group (MAPs: middle aged professionals) Possible LossProbability $0 0.95 $10,000 0.05 • Another Group (YUMs: young unemployed males) Possible LossProbability $0 0.90 $10,000 0.10
Implications of Heterogeneous Buyers • Assume initially that • Equal number of each type • Losses are Independent • Full Insurance is mandatory • Costless to distinguish MAPs from YUMs
Implications of Heterogeneous Buyers • Distribution of Average Claims Costs • Again, we will ignore uncertainty MAPs YUMs
Implications of Heterogeneous Buyers • Initial Scenario: • Equal Treatment Insurance Company is only insurer • Premium for everyone = $750 • Does Equal Treatment cover its costs? • Yes, the YUMs pay less than their expected cost, but the MAPs pay more
Implications of Heterogeneous Buyers • New Scenario: allow competition • Competition from Selective Insurance Company • If Selective assumes Equal Treatment will continue to charge $750, how does Selective set price to maximize profits, • Premium to MAPs = • Premium to YUMs = • Profit per policyholder =
Implications of Heterogeneous Buyers • What happens to Equal Treatment? • It would experience adverse selection • I.e., it would obtain an adverse selection of policyholders -- only the YUMs will purchase from Equal Treatment • Thus, Equal Treatment will have to classify or lose money
Implications of Heterogeneous Buyers • Key Points: Profit Maximization + ==> Risk Classification Competition Lack of Classification + ==> Adverse Selection Competition
Implications of Heterogeneous Buyers • What if full insurance is not mandatory? • Recall, Initial Scenario: • Equal Treatment is only insurer • Equal Treatment charges $750 to everyone • What do MAPs do? • MAPs may not purchase insurance • If not, only YUMs buy from Equal Treatment • Equal Treatment experiences adverse selection
Implications of Heterogeneous Buyers • Key Points: Profit Maximization + ==> Risk Classification Risk Management Alternatives to Insurance Lack of Classification + ==> Adverse Selection Risk Management Alternatives to Insurance
Implications of Heterogeneous Buyers • What if it is costly to identify MAPs? • Go back to initial situation, but suppose that it costs $100 for each MAP identified • Assuming Equal Treatment continues to charge $750, what does Selective charge? • What if the cost per MAP identified = $300?
Implications of Heterogeneous Buyers • Key Point: Profit Maximization Risk Classification + ==> if it is Competition Cost Effective
Is Classification Good for Society? • Public Policy Issue: • From a societal perspective, is risk classification desirable? • Some argue that risk classification should be restricted when • insurance is mandatory (e.g., auto liability) • classification is based on inherited traits (e.g., gender, genes) • classification is based on location of residence (e.g., auto, property) • classificationis based on subjective criteria (e.g., “poor moral risks”)
Is Classification Good for Society? • Framework for evaluating public policy issue: • Four effects of restricting classification 1. Redistributes income • From low risk to high risk • Examples: • Is this fair?
Is Classification Good for Society? 2. Classification will alter insurance prices to certain groups and therefore change behavior • Types of behavior: • amount of insurance purchased • loss control activities • Some changes in behavior may be desirable and some undesirable • Examples: • amount of liability insurance purchased by poor people • smoking • amount of life insurance purchased by people with HIV
Is Classification Good for Society? 3. May decrease classification costs • Ignoring fairness issues (point #1), if there are no behavioral effects of classification (point #2), then costly classification is a waste; • I.e., classification simply redistributes income • Controversial issues: (gender, age, location) have low classification costs
Is Classification Good for Society? 4. Limiting classification may increase regulatory costs • Monitoring of insurers to enforce restrictions • Need to impose other costly restrictions on insurers • marketing activities • underwriting activities • Restrictions lead insurers to not offer coverage • Leads to residual market (involuntary market) mechanisms • Leads to additional costs
Risk Classification Practices • Consumers are classified by various criteria • Class Rate is applies to all consumers in a given classification • Underwriter decides whether a particular consumer will be offered coverage at the class rate • Schedule rating: modification of the rate by the underwriter based on specific characteristics of the consumer (applies mostly to commercial insurance) • Experience rating refers to practice of basing rates on past experience
Recouping versus Updating • Basing rates on past experience is often controversial • Are insurers • recouping past losses or • updating expected losses on future business? • Competition and low switching costs limit the ability of insurers to recoup
Return to Determinants of Fair Premiums • Summary: Ignoring • administrative costs • investment income • profits Fair Premium = Expected Claim Costs || Pure Premium
Investment Income • Key Point: • Fair premium is reduced to reflect investment income on premiums • Equivalently, • Fair Premium = Present Value of Expected Costs
Example to Illustrate Effect of Investment Income • Assume • no administrative costs • one year policies, premium received at beginning • certain claim costs = $100 paid according to table below Fair Premium
Effect of Investment Income Varies Across Lines of Business - Figure 6-2
Administrative Expenses • Fair Premium must cover administrative costs, such as • marketing • underwriting • loss adjustment • premium taxes • underwriting income taxes • etc.
Summary of Determinants of Fair Premiums • Ignoring profit loading • Fair Premium = PV of Expected Costs • Fair Premium = PV of Pure Premium + PV of Expenses • Note: Analysis to this point has been based on expected values • Now take into consideration the uncertainty associated with operations
Effect of Uncertainty: Profit Loading • Uncertainty ==> claim costs could exceed premiums • That is, insolvency is possible • Insurers hold capital to reduce the likelihood of insolvency • Thus, capital providers bear the risk associated with insurance operations • The insurer’s profit is the owners’ compensation for bearing this risk
Summary of Fair Premium Model • Fair Premium = PV of Expected Costs + Profit loading • Other terms for profit loading: • risk load • capital costs
Determinants of Profit Loadings • Actuarial Models: • Variance of distribution of claim costs for that line of business determines risk load • Risk load increases with the unpredictability of claim costs
Determinants of Profit Loadings • Financial Models: • Optimal level of capital given its costs and benefits • Benefits of capital depend on • variance of claim costs • covariance of claim costs across lines and with assets • Cost of holding capital: • tax costs • agency costs
Conclusion • Fair Premium = PV of Expected Claim Costs + PV of Expected Administrative Costs + Profit Loading • Note two meanings of risk • expected losses • unpredictability of losses
Pricing Example 1 $100,000 with prob. 0.02 Loss = $20,000 with prob. 0.08 0 with prob. 0.90 Find Fair Premium if • policy provides full coverage • underwriting costs = 20% of pure premium • claims are paid at end of year • interest rate = 8% • claim processing costs = $5,000 • fair profit = 5% of pure premium
Pricing Example 1 • Solution: • pure premium = $3,600 • PV of expected claims = $3600/1.08 • underwriting costs + fair profit = (0.20 + 0.05) x $3,600 = $900 • expected claim processing costs = $5,000 x 0.10 = $500 • PV of expected claim processing costs = 500/1.08 • Fair premium = 900 + 4,100/1.08 = 900 + 3,796 = $4,696
Pricing Example 2 $100,000 with prob. 0.02 Loss = $20,000 with prob. 0.08 0 with prob. 0.90 Find Fair Premium if • policy has a $20,000 deductible • underwriting costs = 20% of pure premium • claims are paid at end of year • interest rate = 8% • claim processing costs = $5,000 • fair profit = 5% of pure premium
Pricing Example 2 • Solution: • pure premium = 0.02 x $80,000 = $1,600 • PV of expected claims = $1600/1.08 • underwriting costs + fair profit = (0.20 + 0.05) x $1,600 = $400 • expected claim processing costs = 0.02 x $5,000 = $100 • PV of expected claim processing costs =$100/1.08 • Fair premium = $400 + $1,700/1.08 = $400 + $1574 = $1,974
Comparison of the Two Examples • Note difference in loading on the two policies Full coverage Deductible Premium $4,696 $1,974 Expected claim cost $3,600 $1,600 Dollar loading $1,096 $374 Percentage loading 30.4% 23.4% (relative to exp. claim cost) Difference is due to the deductible policy eliminating expected claim processing cost on relatively frequent, low severity claims (see Chapter 8)
Capital Shocks and Underwriting Cycles • Fair premium model does not explain everything • Premiums & coverage appear to • Follow cycles • “hard” markets (prices high, coverage restricted) • “soft” markets (prices low, coverage available) • Change following capital shocks • prices increase, coverage restricted
Capital Shocks and Underwriting Cycles • Cycles and price increases following capital shocks are difficult to explain • Fair premium implies that prices are forward looking • prices depend on expected future costs • prices depend on uncertainty about future costs • What happened in past is irrelevant
Premium Increases Following Capital Shocks • One explanation: • Capital shock depletes insurer capital • Costly to raise new capital • Capital becomes scarce ==> its required return increases • That is, the risk load increases
Underwriting Cycles • Possible explanations • Insurers naively extrapolate from recent past • high (low) losses in the past cause insurers to predict that future losses will be high (low) • Capital shocks, followed by excessive competition • capital shock lowers capital • premiums increase, which replenishes capital • excess capital develops • premiums decrease
Price Regulation • Types • Restrict level or change in rates • prior approval • file and use • competitive • Restrict underwriting criteria
Why Regulate Rates? • Public Interest Perspective: • Correct problems in market place • collusion among insurers • lack of consumer information
Why Regulate Rates? • Economic Theory of Regulation Perspective • Regulation benefits politically influential groups • Possible beneficiaries of price regulation: • Insurers as a group • Inefficient insurers • High risk consumers
Effects of Rate Suppression and Compression • Rate suppression - lower rates below costs • Rate compression - restrict differences in rates across classifications • Suppression and/or compression lead insurers to not voluntarily offer coverage to some groups • which leads to creation of residual market mechanisms (e.g., joint underwriting associations) (JUAs)