Download

1 / 20
200 likes | 324 Views
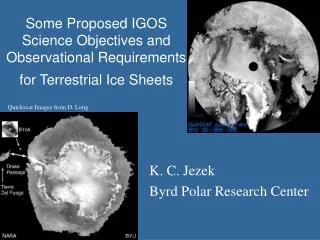
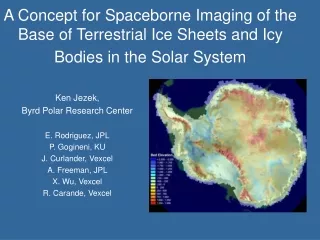
A Concept for Spaceborne Imaging of the Base of Terrestrial Ice Sheets and Icy Bodies in the Solar System. Ken Jezek, Byrd Polar Research Center E. Rodriguez, JPL P. Gogineni, KU J. Curlander, Vexcel A. Freeman, JPL X. Wu, Vexcel R. Carande, Vexcel. Global Ice Thickness Mission.

E N D
A Concept for Spaceborne Imaging of the Base of Terrestrial Ice Sheets and Icy Bodies in the Solar System Ken Jezek, Byrd Polar Research Center E. Rodriguez, JPL P. Gogineni, KU J. Curlander, Vexcel A. Freeman, JPL X. Wu, Vexcel R. Carande, Vexcel
Global Ice Thickness Mission • Key Measurements: • Determine total global volume of ice in glaciers and ice sheets • Map the basal topography of Antarctica and Greenland • Determine basal boundary conditions from radar reflectivity • Map internal structures (bottom crevasses, buried moraine bands, brine infiltration layers) Present error in Balance Velocity % Error
A New Technical Approach Required • Nadir sounding ‘profiler’ cannot meet science requirements: • Beam limited cross-track spatial resolution (1km) requires antenna size beyond current capabilities (420 m at P-band) • Full spatial coverage requires years of mission lifetime (high costs) • Conventional Interferometry is Insufficient • Coverage, spatial resolution, and height accuracy suggest a swath SAR interferometer might meet concept • Ambiguous returns from surface clutter and the opposite side basal layer make this approach not feasible
Interferometric Sounding Concept • Conventional interferometry uses phase information one pixel at a time • Additional information contained in the spatial frequency of the phase: • Because of the difference in incidence angles, the near nadir interferometric phase spatial frequency from the basal return is much larger than the equivalent frequency for surface clutter • Opposite side ambiguities have opposite interferometric frequencies: while the phase in one side increases with range, it decreases with range in the opposite side (+/- spatial frequencies of complex interferogram) • IFSAR sounding concept: spatially filter interferogram to retain only basal returns from one side Satellite height (H); ice surface height (h); Depth of the basal layer (D); topographic variations of the basal layer (d); cross-track coordinate of the basal layer point under observation (xb); and, xs is the cross-track coordinate of the surface point whose two-way travel time is the same as the two-way travel time for xb.
Mission Concept • Two antennas, 45 m baseline, off-nadir boresight - 1.5 degrees • mesh dishes, SRTM-like boom, 50 km swath from 10 to 60 km cross-track • use conventional nadir sounding for layering studies • Fully polarimetric for ionospheric effects • 600 km altitude, 1 year minimum mission lifetime • P-band (430 MHz), 6 MHz bandwidth • attenuation is essentially same at from 100 MHz to 500 MHz • along-track resolution from SAR processing • cross-track resolution from pulse bandwidth
Interferometric Phase and Phase Frequency Complex interferogram Surface interferometric phase difference Basal interferometric phase difference Surface interferogram slope as a function of range.hx is the surface topography cross-track slope Basal Interferogram slope as a function of range. dx is the basal topography cross-track slope (From E. Rodriguez, 2004)
Surface Ambiguous Incidence Angle Surface incidence angle qs as a function of xb for a platform height of 600 km. Notice the slow variation of qs with range in the near-range.
Basal Incidence and Look Angles Near linear variations of basal layer incidence angle q2 as a function of xb for a platform height of 600km (solid lines). The incidence angle is nearly independent of depth. The apparent look angle, q1 is also plotted using dashed lines.
UHF Fringe Spectrum • Interferogram spectra for • first 50 km of xb • - signal to clutter ratio - 1 • - radar freq - 430 MHz • - bandwidth of 6 MHz • Basal spectrum is • colored orange • Surface spectra for • - D = 1 km (black), • - D = 2 km (red), • - D = 3 km (green), • - D = 4 km (blue). • Note the basal fringe • spectrum depends very • weakly on depth
Back propagationsimulation (snow) range (100 km ground range) Surface DEM (a) and basal DEM (b), which is 1000 m lower than surface DEM. Interferogram fom both the surface and the basal DEM contributions. 60 m baseline; multi-looked with 1 (range) by 7 (azimuth).
Instrument ConceptKey Parameters Polarimetric 4 channels Center frequency 430 MHz Bandwidth 6 MHz Pulse length 20 ms Peak transmit power 5 kW System losses -3 dB Receiver noise figure 4 dB Platform height 600 km Azimuth resolution 7 m PRF 10 kHz Duty cycle 20 % Antenna length 12.5 m Antenna efficiency -2. dB 1-way Antenna boresight angle 1.5 deg Wavelength 0.7 m Baseline 45 m Swath 50 km Minimum number of looks 500
Performance Estimate Assumed Antenna Pattern • Assume uniform circular illumination • Antenna diameter 12.5m • consistent with available space qualified antennas • Antenna boresight: 1.5deg • Assumed antenna efficiency: -2dB 1-way Model Backscatter Cross Section • The backscatter model consists of two contributions: • Geometrical optics (surface RMS slope dependent) • Lambertian scattering • assumed Lambertian contribution at nadir: -25dB
Observed Surface Sigma0 Angular Dependence at 120 MHz • Data obtained with the JPL Europa Testbed Sounder in deployment with the Kansas U. sounder over Greenland • Angular decay near nadir (>15 dB in 5 degrees) consistent with very smooth ice surface • Change in behavior at P-band is still unknown, but probably bounded by 1-3 degree slope models
Preliminary Conclusions • The interferometric sounding concept has the potential to make the desired ice sheet depth measurement for depths > 1km • For depths < 1km and for ice layering, conventional sounding approach may be sufficient • Results depend on P-band clutter roll-off • At smaller depths (~1km) surface clutter contamination dominates: must be able to show clutter rejection for 10dB clutter to signal ratios for highest attenuation rates • For other depths, clutter to signal ratios are much better and can be removed using IFSAR filtering • At ~4 km depths, SNR is poor but sufficient to meet height accuracies • There are no major technological hurdles in the design, although the power requirements are high (for deep ice) • P-band experimental angular clutter measurements are highly desirable. • Clutter rejection study ongoing
Clutter Effect on Interferometric Error Height error as a function of signal to clutter (a/b) for a baseline of 45 m and a center frequency of 430~MHz (solid lines) and 130 MHz (dashed lines). The values of (a/b) are: 1 (blue), 0.1 (red), and 0.01 (black).
Height Noise vs SNR Height error as a function of SNR for a baseline of 45m and a center frequency of 430 MHz (solid lines) and 130 MHz (dashed lines). The values of SNR are: 0 dB (blue), -5 dB (red), and -10 dB (black). The number of looks is assumed to be 100.