Download
1 / 1
10 likes | 85 Views
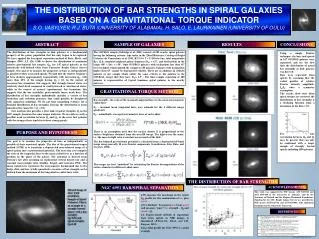
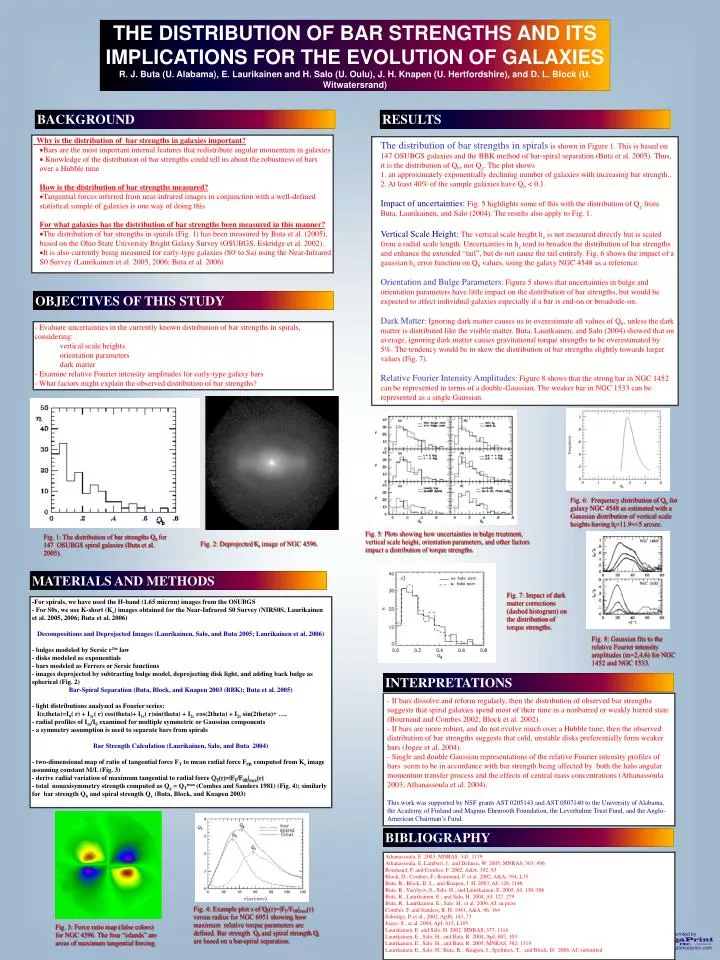
THE DISTRIBUTION OF BAR STRENGTHS AND ITS IMPLICATIONS FOR THE EVOLUTION OF GALAXIES R. J. Buta (U. Alabama), E. Laurikainen and H. Salo (U. Oulu), J. H. Knapen (U. Hertfordshire), and D. L. Block (U. Witwatersrand). BACKGROUND. RESULTS.

E N D
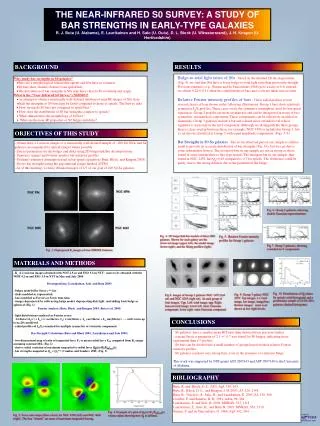
THE DISTRIBUTION OF BAR STRENGTHS AND ITS IMPLICATIONS FOR THE EVOLUTION OF GALAXIES R. J. Buta (U. Alabama), E. Laurikainen and H. Salo (U. Oulu), J. H. Knapen (U. Hertfordshire), and D. L. Block (U. Witwatersrand) BACKGROUND RESULTS • Why is the distribution of bar strengths in galaxies important? • Bars are the most important internal features that redistribute angular momentum in galaxies • Knowledge of the distribution of bar strengths could tell us about the robustness of bars over a Hubble time How is the distribution of bar strengths measured? • Tangential forces inferred from near-infrared images in conjunction with a well-defined statistical sample of galaxies is one way of doing this For what galaxies has the distribution of bar strengths been measured in this manner? • The distribution of bar strengths in spirals (Fig. 1) has been measured by Buta et al. (2005), based on the Ohio State University Bright Galaxy Survey (OSUBGS, Eskridge et al. 2002). • It is also currently being measured for early-type galaxies (S0- to Sa) using the Near-Infrared S0 Survey (Laurikainen et al. 2005, 2006; Buta et al. 2006) • The distribution of bar strengths in spirals is shown in Figure 1. This is based on 147 OSUBGS galaxies and the BBK method of bar-spiral separation (Buta et al. 2005). Thus, it is the distribution of Qb, not Qg. The plot shows • 1. an approximately exponentially declining number of galaxies with increasing bar strength.. • 2. At least 40% of the sample galaxies have Qb < 0.1. • Impact of uncertainties: Fig. 5 highlights some of this with the distribution of Qg from Buta, Laurikainen, and Salo (2004). The results also apply to Fig. 1. • Vertical Scale Height: The vertical scale height hz is not measured directly but is scaled from a radial scale length. Uncertainties in hz tend to broaden the distribution of bar strengths and enhance the extended “tail”, but do not cause the tail entirely. Fig. 6 shows the impact of a gaussian hz error function on Qb values, using the galaxy NGC 4548 as a reference. • Orientation and Bulge Parameters: Figure 5 shows that uncertainties in bulge and orientation parameters have little impact on the distribution of bar strengths, but would be expected to affect individual galaxies especially if a bar is end-on or broadside-on. • Dark Matter: Ignoring dark matter causes us to overestimate all values of Qb, unless the dark matter is distributed like the visible matter. Buta, Laurikainen, and Salo (2004) showed that on average, ignoring dark matter causes gravitational torque strengths to be overestimated by 5%. The tendency would be to skew the distribution of bar strengths slightly towards larger values (Fig. 7). • Relative Fourier Intensity Amplitudes: Figure 8 shows that the strong bar in NGC 1452 can be represented in terms of a double-Gaussian. The weaker bar in NGC 1533 can be represented as a single Gaussian. OBJECTIVES OF THIS STUDY - Evaluate uncertainties in the currently known distribution of bar strengths in spirals, considering: vertical scale heights orientation parameters dark matter - Examine relative Fourier intensity amplitudes for early-type galaxy bars - What factors might explain the observed distribution of bar strengths? Fig. 6: Frequency distribution of Qb for galaxy NGC 4548 as estimated with a Gaussian distribution of vertical scale heights having hr=11.9+/-5 arcsec. Fig. 5: Plots showing how uncertainties in bulge treatment, vertical scale height, orientation parameters, and other factors impact a distribution of torque strengths. Fig. 1: The distribution of bar strengths Qb for 147 OSUBGS spiral galaxies (Buta et al. 2005). Fig. 2: Deprojected Ks image of NGC 4596. MATERIALS AND METHODS Fig. 7: Impact of dark matter corrections (dashed histogram) on the distribution of torque strengths. -For spirals, we have used the H-band (1.65 micron) images from the OSUBGS - For S0s, we use K-short (Ks) images obtained for the Near-Infrared S0 Survey (NIRS0S, Laurikainen et al. 2005, 2006; Buta et al. 2006) Decompositions and Deprojected Images (Laurikainen, Salo, and Buta 2005; Laurikainen et al. 2006) - bulges modeled by Sersic r1/n law - disks modeled as exponentials - bars modeled as Ferrers or Sersic functions - images deprojected by subtracting bulge model, deprojecting disk light, and adding back bulge as spherical (Fig. 2) Bar-Spiral Separation (Buta, Block, and Knapen 2003 (BBK); Buta et al. 2005) - light distributions analyzed as Fourier series: I(r,theta)=I0( r) + I1c( r) cos(theta)+ I1s( r)sin(theta) + I2c cos(2theta) + I2s sin(2theta)+ …. - radial profiles of Im/I0 examined for multiple symmetric or Gaussian components - a symmetry assumption is used to separate bars from spirals Bar Strength Calculation (Laurikainen, Salo, and Buta 2004) - two-dimensional map of ratio of tangential force FT to mean radial force F0R computed from Ks image assuming constant M/L (Fig. 3) - derive radial variation of maximum tangential to radial force QT(r)=|FT/F0R|max(r) - total nonaxisymmetry strength computed as Qg = QTmax(Combes and Sanders 1981) (Fig. 4); similarly for bar strength Qb and spiral strength Qs (Buta, Block, and Knapen 2003) Fig. 8: Gaussian fits to the relative Fourier intensity amplitudes (m=2,4,6) for NGC 1452 and NGC 1533. INTERPRETATIONS - If bars dissolve and reform regularly, then the distribution of observed bar strengths suggests that spiral galaxies spend most of their time in a nonbarred or weakly barred state (Bournaud and Combes 2002; Block et al. 2002). - If bars are more robust, and do not evolve much over a Hubble time, then the observed distribution of bar strengths suggests that cold, unstable disks preferentially form weaker bars (Jogee et al. 2004). - Single and double Gaussian representations of the relative Fourier intensity profiles of bars seem to be in accordance with bar strength being affected by both the halo angular momentum transfer process and the effects of central mass concentrations (Athanassoula 2003; Athanassoula et al. 2004). This work was supported by NSF grants AST 0205143 and AST 0507140 to the University of Alabama, the Academy of Finland and Magnus Ehrnrooth Foundation, the Leverhulme Trust Fund, and the Anglo-American Chairman’s Fund. BIBLIOGRAPHY Athanassoula, E. 2003, MNRAS, 341, 1179 Athanassoula, E, Lambert, J., and Dehnen, W. 2005, MNRAS, 363, 496 Bournaud, F. and Combes, F. 2002, A&A, 392, 83 Block, D., Combes, F., Bournaud, F. et al. 2002, A&A, 394, L35 Buta, R., Block, D. L., and Knapen, J. H. 2003, AJ, 126, 1148 Buta, R., Vasylyev, S., Salo, H., and Laurikainen, E. 2005, AJ, 130, 506 Buta, R., Laurikainen, E., and Salo, H. 2004, AJ, 127, 279 Buta, R., Laurikainen, E., Salo, H., et al. 2006, AJ, in press Combes, F. and Sanders, R. H. 1981, A&A, 96, 164 Eskridge, P. et al., 2002, ApJS, 143, 73 Jogee, S., et al. 2004, ApJ, 615, L105 Laurikainen, E. and Salo, H. 2002, MNRAS, 337, 1118 Laurikainen, E., Salo, H., and Buta, R. 2004, ApJ, 607, 103 Laurikainen, E., Salo, H., and Buta, R. 2005, MNRAS, 362, 1319 Laurikainen, E., Salo, H., Buta, R., Knapen, J., Speltincx, T., and Block, D. 2006, AJ, submitted Fig. 4: Example plot s of QT(r)=|FT/F0R|max(r) versus radius for NGC 6951 showing how maximum relative torque parameters are defined. Bar strength Qb and spiral strength Qs are based on a bar-spiral separation. Fig. 3: Force ratio map (false colors) for NGC 4596. The four “islands” are areas of maximum tangential forcing.