Download
1 / 4
40 likes | 57 Views
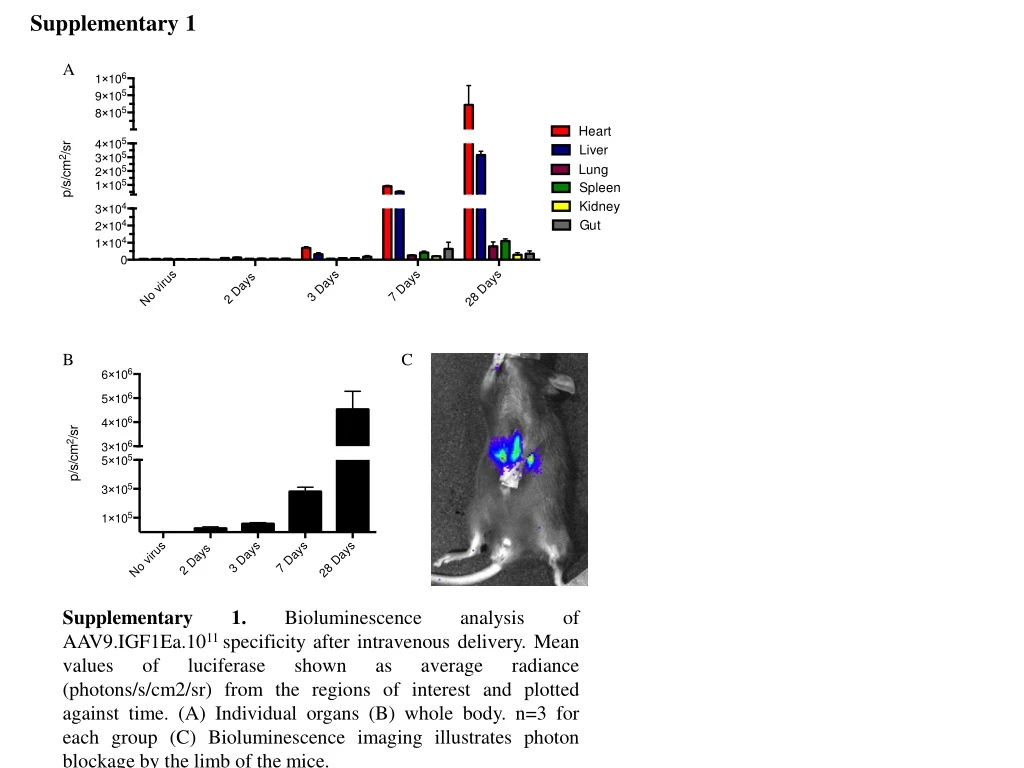
This study investigates the specificity of AAV9-IGF1Ea after intravenous delivery using bioluminescence analysis. The average radiance of luciferase in various organs and the whole body is measured over time. The photon blockage by the limb of mice is also visualized.

E N D
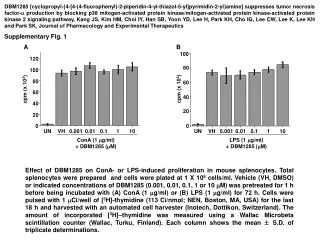
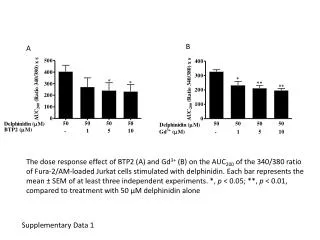
Supplementary 1 A B C Supplementary 1. Bioluminescence analysis of AAV9.IGF1Ea.1011 specificity after intravenous delivery. Mean values of luciferase shown as average radiance (photons/s/cm2/sr) from the regions of interest and plotted against time. (A) Individual organs (B) whole body. n=3 for each group (C) Bioluminescence imaging illustrates photon blockage by the limb of the mice.
Supplementary 2 A Liver B Lung Supplementary 2. IGF-1Ea mRNA levels 28 days post-infarction in (A) liver and (B) lung. n= 5-9 per group. The dashed line shows the mRNA levels of uninjured mice. One-way ANOVA with Dunnett’s Multiple Comparison test. I/R group (no viral treatment group) as control group.
Supplementary 3 A B Supplementary 3. (A) Cola1a1/Col3a1 ratio in the remote region. (B)CD68 mRNA relative levels were analyzed by qRT-PCR at 28 days post-infarction. n= 5-9 per group. The dashed line shows the mRNA levels of uninjured mice.One-way ANOVA with Dunnett’s Multiple Comparison test. I/R group (no viral treatment group) as control group.
Supplementary 4 I/R I/R + IGF1Ea.1011 A A B C D Supplementary. 4. Phospho-H3 immunohistochemistry of (A and B) no virus group (I/R) and (C and D) IGF-1Ea 3.5x10¹¹ GC treated, 28 days after ischemia/reperfusion. Scale bar (A and C), 250 um. Scale bar (C and D), 100 um.