Download
1 / 34
340 likes | 379 Views
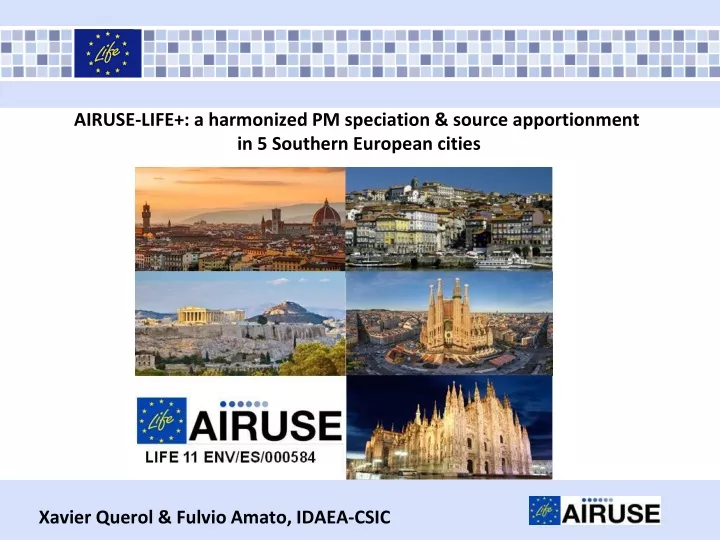
A iruse -Life +: a harmonized PM speciation & source apportionment in 5 Southern European cities. Xavier Querol & Fulvio Amato, IDAEA-CSIC. MEAN PM10 & PM2.5 LEVELS IN EUROPE. ESCAPE. Eeftens et al. (2012) Atmospheric Environment. PECULIARITIES OF SOUTHERN EUROPEAN CITIES.

E N D
Airuse-Life+: a harmonized PM speciation & source apportionmentin 5 Southern European cities Xavier Querol & Fulvio Amato, IDAEA-CSIC
MEAN PM10 & PM2.5 LEVELS IN EUROPE ESCAPE Eeftens et al. (2012) Atmospheric Environment
THE AIRUSE PROJECT AIMS • Characterizing similarities & differences in PM sources & contributions across S-EU (5 cities) • Once the main sources of PM10 and PM2.5 are identified, the strategic goal of the AIRUSE project is to develop, test and propose specific (and non) measuresto abate urban ambient air PM in S.-EU, to meet AQ standards & to approach WHO guidelines. • Specific objectives • Obtaining harmonized source contributions to PM for AIRUSE cities & to identify those responsible for exceedances of the PM limit values and WHO guidelines • Develop, test and propose cost-effective air mitigation measures for South European countries • Support adaptation of control strategies for reducing PM exposure in South Europe • Specific PM mitigation measures • Street washing & dust suppressants for road dust and deposited African dust • Biomass burning • Industrial emissions (channelled and fugitive) • Strategies from other European countries (LEZ, eco-efficient vehicles, labelling, shipping, biomass burning…)
AIRUSE COORDINATION STRUCTURE Coordinating Beneficiary Project Manager Spain Associated Beneficiaries Leader B3 D2 Greece Leader B2 Italy Leader B4 Portugal Milan Italy Leader B8 UK Leader B5 D5 Spain
AIR QUALITY TRENDS SPAIN 2001-2012 −2.8 to −3.7%/year −3.6 to −7.7%/year −2.3 to−4.2%/year −6.1%/year −2.5%/year Querol et al., 2014. Science of Total Environment
AQ TRENDS SPAIN 2001-2012 −3.8%, −6.4% and −5.1%/year −3.1%/year +1.7, +3.0 and +1.2%/year Querol et al., 2014. Science of Total Environment
AQ TRENDS SPAIN 2001-2012 −1.9,−3.3, and−4.7%/year −2.7%/year −1.7 to -5.1%/year −1.7 to -3.4%/year −2.5%/year −2.2%/year Querol et al., 2014. Science of Total Environment
2003-2014 PM10 and PM1 source apportionment: Barcelona See M. Pandolfi’s talk on Wednesday
ANNUAL PM10 AVERAGES FI-AGG ATH-GAA
HARMONIZED 2013 PM10 & PM2.5 SOURCE APPORTIONMENT 1047 PM10 samples 1116 PM2.5 samples
HARMONIZED 2013 PM10 & PM2.5 SOURCE APPORTIONMENT Example PM10
Traffic contributions PM10 PM10 • VEX (7-23%), NEX (8-11%), SNI (5-18%) • at SUB-UB sites, VEX and NEX are nowadays similar • at the TR siteVEX dominates (Maritime climate) PM2.5 PM2.5 • VEX (6-31%), NEX (1-9%), SNI (2-19%) • VEX dominates in PM2.5, except in MLN
HARMONIZED 2013 PM10 & PM2.5 SOURCE APPORTIONMENT PM2.5 Levoglucosan K PM2.5
2013 MEAN EXCEEDANCES DAYS
ACKNOWLEDGEMENTS www.airuse.eu Spain MAGRAMA, GenCat, Barcelona and Madrid City Councils Italy ARPA-Lombardia, RegioneLombardia, Regional Government of Tuscany, ARPA Toscana Portugal Porto City Council, North Regional Coord. & Develop. Comm. (CCDR-N) GreeceMinistry of Environment, Energy and Climate Change • SpainM. BrritteLarka, A. Orio, M. Pallares, I. Hernández, A. Cristobal, E. Aulí • Portugal C. Figueiredo (CCDR-N); J. Monjardino (CENSE, Universidade Nova de Lisboa) Italy F. Forni (Regione Toscana), Greece M. Lazaridis y AthinaProgiou (Project ACEPT AIR) Thank you very much for your attention!!! • xavier.querol@idaea.csic.es fulvio.amato@idaea.csic.es
PM10 (annual mean) PM10 (days of exceedance) 1. Road Traffic is the main source contributing to PM10: 31-38% (ATH 23%) 1.1. Vehicle exhaust + traffic related NO3-are the main causes: 21-29% (ATH 15%) 1.2. Non-exhaust vehicle emissions are also relevant: 8-11% 2. Regional OC and/or SO42-dominated pollution: 14-26% (POR-TR 10%) 3. Local dust : 7-19% 4. Biomass burning very relevant in MLN, POR & FI (14-24%), in ATH (7%) and negligible in BCN 5. Industry BCN 11%, 4-9%, ATH <1% 6. Non traffic-NO3-5-8% (2% POR) 7. Shipping 4% in coastal sites • 8. African dust ATH 14%, 1-4% • 9. Sea salt POR 13%, 3-8% 10. Anthropogenic dust (Local dust + Non exhaust) reaches 16-25% 36-45% (ATH 15%) 27-34% (ATH 6%) 14-29% (ATH 3%, POR 6%) BCN 19%, 2-9% POR 27%, 1-4% 25-35%, ATH 1%, negligible in BCN BCN 17%, <1-4% 6-9% (1-2% POR & ATH) 3-4% in coastal sites ATH 52%, 1% ATH 7%, 1-3% 11-33%, ATH 4% PM2.5 (annual mean) PM2.5 (days of PM10 exceedance) 1. Road Traffic is the main source contributing to PM2.5: 28-39% (ATH 22%) 1.1. Vehicle exhaust + traffic related NO3- are the main causes: 25-34% (ATH 17%) 1.2. Non-exhaust vehicle emissions are also relevant: 5-9% (BCN&FI 1-2% ) 2. Regional OC and/or SO42-dominated pollution: 19-37% (POR 13%) 3. Local dust: POR 16%, 2-6% 4. Biomass burning very relevant in MLN, FI & POR (18-21%), less in ATH (10%) and negligible in BCN 5. Industry5-12%, ATH <1% 6. Non traffic-NO3-3-6%(POR 1%) 7. Shipping 5-7% in coastal sites 8. African dust: ATH 6%, <1% 9. Sea salt POR 5%, <1-3%, 10. Anthropogenic dust (Local dust + Non exhaust) reaches 10-21%, BCN 7%, FI4% 32-42% (ATH 11%) 31-40% (ATH 10%) 1-8% BCN & MLN 11-22%, 2-6% POR 22%,1-2% POR, FI & MLN (26-33%), <2% BCN 18%, <1-3% BCN, FI & MLN 6-9% (1-3% POR & ATH) 6-10% in coastal sites ATH 45%, 1% <1%-1% POR 15, 3-9%
*Shipping in ATH includes also heavy oil combustion from industrial plants and maybe some residential oil combustion for heating as well.
*Shipping in ATH includes also heavy oil combustion from industrial plants and maybe some residential oil combustion for heating as well.
At each site, 3 traffic sources were found • Vehicle exhaust (VEX) • Vehicle non-exhaust (NEX) • Secondary nitrate (SNI), traffic-related share based on EI of NOx
AIRUSE STRUCTURE: ACTIONS & TASKS (1/2) ACTION A. Preparatoryactions A.1 Authorities and stakeholders consultation B1. Documentation of the current status ACTION B. Implementationactions B2. Harmonization and implementation of source apportionment using receptor modelling & determination of the impact of: B7. Developing & testing cost-effective PM measures & strategies B3. Natural sources B4. Biomass burning B8. Applicability of selected measures from N to S Europe B5. Industrial sources B6. Traffic related sources Intensive additional work on inventories, emission chemical profiles, emission factors C1. Effectiveness of the project actions ACTION C. Implementationactions C2. Assessment of the socio-economic impact
AIRUSE STRUCTURE: ACTIONS & TASKS (2/2) D1. Project website D2. LIFE+ Information boards ACTION D. Communication & Disseminationactions D3. Networking-Open forum with key stakeholders D4. Dissemination of project results D5. Layman's Report E1. Project Management & Audit E2. Monitoring of the project progress ACTION E. Project management & monitoring of the project progress E3. Networking with other projects E4. After-LIFE+ Plan
HARMONIZED 2013 PM10 & PM2.5 SOURCE APPORTIONMENT ANNUAL DAILY (P90.4) PM2.5 ATV (2008/50/EC) DLV (2008/50/EC) µg/m3 WHO GUIDE µg/m3 ANNUAL ALV (2008/50/EC) PM2.5/PM10 PM10 WHO GUIDE µg/m3