Download
1 / 21
210 likes | 224 Views
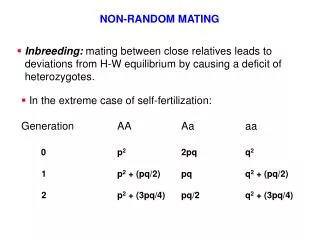
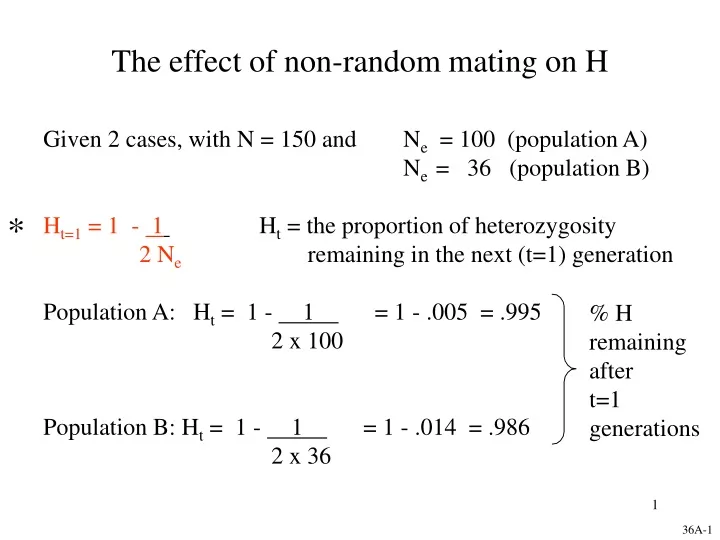
The effect of non-random mating on H. Given 2 cases, with N = 150 and N e = 100 (population A) N e = 36 (population B) H t=1 = 1 - 1 H t = the proportion of heterozygosity 2 N e remaining in the next (t=1) generation

E N D
The effect of non-random mating on H Given 2 cases, with N = 150 and Ne = 100 (population A) Ne = 36 (population B) Ht=1 = 1 - 1 Ht = the proportion of heterozygosity 2 Ne remaining in the next (t=1) generation Population A: Ht = 1 - 1 = 1 - .005 = .995 2 x 100 Population B: Ht = 1 - 1 = 1 - .014 = .986 2 x 36 * % H remaining after t=1 generations 36A-1
Generalized equation: Ht = H0 1 - 1 tt = # of generations later 2NeH0 = original heterozygosity What is H after 5 more generations? Population A: H5 = H0 (.995) 5 = .995 (.995)5 = .970 Population B: H5 = H0 (.986) 5 = .995 (.986)5 = .919 * 36A-2
Formulae for calculating H and Ne 1 = proportion of H0 lost at each generation 2Ne 1 - 1 = proportion of H0 remaining after the first generation 2 Ne assuming H = 100% at the start. Ht = H0 1 - 1 t = the absolute amount of H0 remaining after 2Ne t generations Ne = 4 MF 1) unequal sex ratios or M + F 2) nonrandom breeding decrease Ne 37A
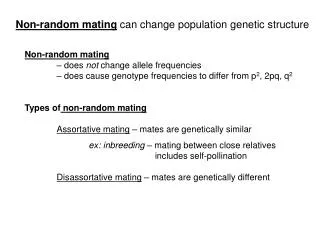
5 causes of microevolution 1) genetic drift - stochastic variation in inheritance 2) Assortative mating 3) Mutation 4) Natural selection 5) Migration (gene flow) 31a-2
Theory of Natural Selection 1859 - proposed by Darwin and Wallace 1866 - Mendel publishes his theories on inheritance 1930s - Neo-Darwinian Natural Selection 37e-1
Theory of Natural Selection 1) Natural selection acts within populations, which are composed of individuals interacting with their environment. 2) Populations have variation and variation is heritable. 3) Differential fitness 37e-1
Natural Selection • Results in increases in the frequency of environmentally advantageous alleles I.e., adaptation to local environment (biotic and abiotic) • This change in allele frequencies and adaptation is an example of microevolution. • Allele frequencies in populations track environmental change 37e-2
Selection Pressure: Positive/negative selection: the process by which organisms leave differentially more/fewer offspring because they have inherited advantages/disadvantages. Selection coefficient: “S” = a measure of selection pressure S = deviations from Hardy-Weinberg expectations for a given genotype at a given locus. Relative fitness of a genotype is the proportion of alleles that it contributes to the next generation, relative to the contribution by other genotypes = w = f (viability, fecundity) 38e
stabilizing directional disruptive Distibution of phenotypes in popn. as natural selection begins After selection has occurred 26
Effect of directional selection on allele frequencies 2 homozygous genotypes at the locus: AA aa If wAA < waa then there is directional selection for homozygote aa. Allele “a” will replace allele “A” Allele “a” will become “fixed” in the popn. w = fitness 40f
Estimating fitness from data taken before and after selection within the same generation Number of individuals with each genotype (obtained by counting) AA Aa aa Before selection 4,000 5,100 2,300 After selection 3,800 4,200 1,200 Survival Rate 3,800/4,000 4,200/5,100 1,200/2,300 = .95 = .82 = .52 w = Relative fitness= .95/.95 = 1.0 .82/.95 = .86 .52/.95 = .55 s = Selection coefficient = 0 = .14 = .45 w = 1 - s s = 1 - w * 41F
Directional selection and changes in allele frequencies For simple dominance and two alleles genotype AA Aa aa initial frequency p2 2pq q2 selection coefficient 0 0 s relative fitness (w) 1-0 1-0 1-s Formula to calculate change in f (A) (= p): p = s p q2(after 1 generation) 1 - s q2 * 40a-1
p = s p q2 (after 1 generation) 1 - s q2 If s = 0.1 p = 0.5 q = 0.5 then p = 0.013 p’ = 0.5 + 0.013 = 0.513 q’ = 1- 0.513 = 0.487 Rate of replacement of “a” by “A”: a function of allele frequencies and strength of s 40a-2
stabilizing directional disruptive As natural selection begins Alleles lost from the popn., therefore decreased P Changes in H depend on whether het. Or homo. Genotype favored After selection has occurred 26
Directional selection in peppered moths (Biston betularia) in England 2 phenotypes: black moth, mottled white moth Prior to 1600 (pre-Industrial revolution) black form approximately 1% white form approximately 99% After 1600 (widespread industrial pollution, smoke and soot. Yuk!) black form approximately 90% white form approximately 10% Now (local pollution from smokestacks) Near pollution source Away black form 50% 10% white form 50% 90% 41
stabilizing directional disruptive As natural selection begins After selection has occurred 26
Stabilizing selection Mortality of sparrows in storms body sizesurvival small low medium medium large low Survival of Common Swift eggs (Lack) clutch size survival 2 1.92 3 2.60 4 1.80 40f3
stabilizing directional disruptive As natural selection begins After selection has occurred 26
stabilizing directional disruptive As natural selection begins After selection has occurred P H P H P H ? ? ? 26
Dynamic Effects: Natural Selection maintains allele frequencies in equilibrium with environmental demands vs. Genetic Drift pulls allele frequencies away from environmental equilibrium 31a-2
Emigration / Immigration Pollen grains Recipient population Donor population Gene flow via emigration from one population and immigration into the other. Migration (m) results in increased H and increased P 41f4