Download
1 / 6
60 likes | 195 Views
Lessons from a National Indicator Experiment. Presented by William C. Clark Harvard University Project Chair February 19, 2004. The Report in brief…. Response to National Performance Review, initiated by White House OSTP in 1995;

E N D
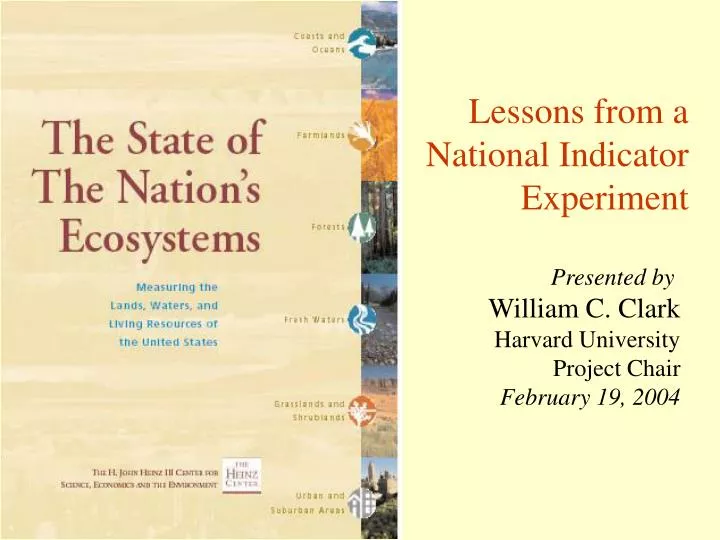
Lessons from a National Indicator Experiment Presented by William C. Clark Harvard University Project Chair February 19, 2004
The Report in brief… • Response to National Performance Review, initiated by White House OSTP in 1995; • A system of strategic indicators for reporting on the changing state of the nation’s ecosystems… • Summarizing the data available on those indicators; highlighting and analyzing data gaps; • Produced through an ongoing process involving business, government, environmental organizations and academia • >300 people over 7 years in an evolving process; ~$1M/year. • Intended for periodic revisions (Full print editions 2002, 2007…), annual web updates (2003 version just released); • So far, so good… (Survived change in Administration; Gratifying response to publication from all sectors, sides)
How to fail… • Review of past environmental indicator efforts identifies multiple failures since 1972… • Finds that the leading “causes of death” for otherwise serious efforts are lack of one or more of the following: • saliency (relevance to, and usability in, national debates on environmental policy) • legitimacy (perception that selection of which [salient] indicators to report is politically fair and unbiased) • credibility (use of rigorous science, free from fact or appearance of political vetting, to determine which numerical values to assign the selected indicators)
How not to fail (yet…): Strategic lessons • Conceive indicator effort as production not of product alone, but rather of continuing process to create, maintain saliency, credibility, legitimacy of overall effort; • Make institutional choices that emphasize need for balance among these criteria; • avoid early choices that imply primacy of one over the others (eg. NAS for credibility, CEQ for saliency, USC for legitimacy…); • Recognize the inherently political character of indicator efforts (“we are what we measure”), and therefore • nurture them on transparently neutral turf (eg. NBER for early economic efforts, Heinz Center for early ecosystem efforts) • move indicator systems to permanent home (in government agencies or elsewhere) only when mature and professionalized.
How not to fail (yet…): Tactical lessons • Design & oversight by stakeholders (hands on!) • government (fed, state, local), business, enviros, academics • Focus on specific goal/audience (can’t be all things…) • decision makers, publics interested in national priorities, not regulators of particular things or managers of particular places • Indicator selection should be goal-driven, not measurement-driven (avoid “looking under lamp posts”) • 50% of our report is “blank boxes”… and what needed to fill them. • Be succinct (indicators to describe the forest, not the trees) • 10 national indicators (and much blood on the floor) • “Just the facts” (to avoid politicization of process) • Report “state” not pressures/ responses (eg. “unemployment”) • Descriptive, not evaluative (no “grades” on the report) • Adaptive approach to learning better goals and means… • Prototype… Stakeholder feedback… Major design changes • Web-based design (print secondary) to discover real audience…
More Information • The Report itself (plus 2003 update) • www.heinzctr.org/ecosystems • The Project Manager • Robin O’Malley, The Heinz Center • omalley@heinzctr.org • The Chair of the Design Committee • Bill Clark, Harvard University • william_clark@harvard.edu