Download
1 / 28
280 likes | 445 Views
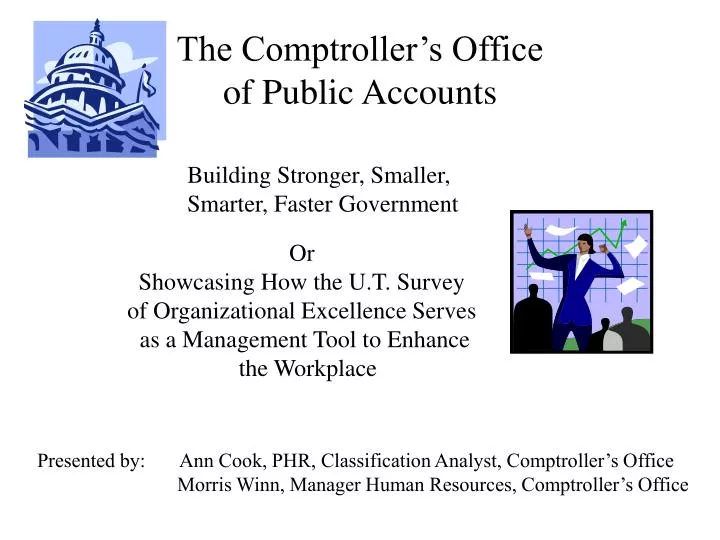
The Comptroller’s Office of Public Accounts. Building Stronger, Smaller, Smarter, Faster Government. Or Showcasing How the U.T. Survey of Organizational Excellence Serves as a Management Tool to Enhance the Workplace.

E N D
The Comptroller’s Officeof Public Accounts Building Stronger, Smaller, Smarter, Faster Government Or Showcasing How the U.T. Survey of Organizational Excellence Serves as a Management Tool to Enhance the Workplace Presented by: Ann Cook, PHR, Classification Analyst, Comptroller’s Office Morris Winn, Manager Human Resources, Comptroller’s Office
Texas Comptroller of Public Accounts Our Purpose As Texas’ chief financial officer, the Comptroller collects taxes and fees owed the state and recommends ways of streamlining government And making it leaner, more efficient and accountable to taxpayers.
Heart and Soul of State Government We provide reforms for streamlining government, making services more efficient and less costly. We are the state’s traffic cops, looking for ways of cutting waste. We collect taxpayer’s money and watch over the way those dollars are spent. We estimate revenue for the biennial budget and project the rate of economic growth and activity.
Heart and Soul of State Government We administer more than 30 state taxes and process 3.3 million tax returns annually. We collect the overwhelming majority of taxes due the state. In the coming biennium, we will collect $48.7 billion (including & 27.6 billion in sales taxes, more than $5.3 billion in motor fuel taxes and $4.2 billion in franchise taxes). We dispense state dollars. One of our many responsibilities is to handle payroll for all state agencies and cut monthly paychecks for all state employees. In addition, we pay every bill submitted to the state.
Heart and Soul of State Government We track 640 state funds and accounts. In order to be readily accessible, we maintain 17 audit and 34 enforcement offices throughout Texas and an active Web site. We operate a dozen toll-free phone lines handling an average of 475 calls every hour. We handle questions from businesses and consumers and try to answer each one promptly.
Heart and Soul of State Government We put a price tag on most pieces of legislation Our property tax division works with appraisal districts statewide to compile accurate figures for the value of land and buildings. We audit school districts for efficiency and effectiveness and give them ways to channel more of every dollar to classrooms, where they belong.
Comptroller Carole Keeton Rylander’s Ten Principles for Texas in the New Century • Develop a better-educated workforce • Direct more of every education dollar into the classroom • Raise the bar on student performance • Cut taxes in Texas. • Introduce competition into government • Improve government performance and accountability • Reduce the size of government • Bring common sense to regulations • Use technology to cut costs and increase quality • Return control to communities and individuals
A Time Sensitivity Approach to the Survey September – November 1999 Events The Idea & Preparation Phase *Human Resources Brainstorming *Additional Questions & Organizational Codes developed in conjunction with survey office *Electronic Employee list sent to survey office. *Personnel Liaison kick-off activities *Pre-Survey Distribution activities including E-mails, newsletter articles, flyers, posters & cross-agency mixers Ideas
The Survey Distribution & Data Collection Phase November – December 1999 • Survey delivered to Agency • Employee Participation Reminders • Survey completed by Employees
Survey Data Interpretation Phase December 1999 – January 2000 • Agency Survey Analysis prepared • Survey results delivered to Executive Management • Survey results distributed to Employees
The Assessment & Implementation Phase January – June 2000 *Survey results provided to Agency Planners for Strategic Plan. *Shadow Managing Executives in how to use results. *Final Report to Executive Management On identifying Initiatives to improve programs.
The Business Problem (s) Problem(s) How to secure the maximum Employee Participation In this first-time survey. Root causes of Problem *Employee Apathy *Skepticism with survey anonymity *Results will not impact status quo…..why bother? Strategies for Improving *Small group meetings with Employees/Managers *Project leaders available to Rank and File employees *Recruiting division cheerleaders
The Business Problem (s) Problem(s) How to secure Top Agency Management or Executive Level buy-in to the survey. Root causes of Problem *Agency has not previously participated in survey. *Agency headed by elected official Strategies for Improving *Find common ground *Elected Official must be daring and willing to think “out of the box.”
EXAMPLES OF COMMUNICATION
TO: Comptroller Employees FROM: Morris Winn, Manager of Human Resources SUBJECT: Survey of Organizational Excellence DATE: December 1, 1999 Your Opinion Counts and Here’s Why The State of Texas and Comptroller Rylander want your opinion and here’s why. The Comptroller’s Office is one of more than 55 other state agencies that will participate in the Survey of Organizational Excellence this year. The Survey is a state employee satisfaction survey administered by the School of Social Work at the University of Texas. The Survey is a tool used by agency and state leadership to assess from the employees’ perspective the quality of life in the workplace. Comptroller Rylander wants your help in assessing the effectiveness of our agency, what you think our organization is doing well and where you think we need to improve. Survey results will be shared with agency management and employees and used to pinpoint areas where we are successful and identify areas where we need to make improvements. An independent contractor tabulates survey results and individual survey responses remain anonymous. The Survey of Organizational Excellence was distributed the week of November 29, 1999 and employees have approximately 14 days to complete the survey. Our goal for this survey is a 100 percent employee response rate. The more employees that complete the survey assures a more accurate picture of the agency’s strengths and areas for improvement. Additional information about the survey is available on the Internet at http://www.utexas.edu/depts/sswork/survey/. If you have general questions regarding the survey please contact LaDene Dorsett at 936-2831, Curt Besselman at 463-4792 or your survey liaison. c John Colyandro Mike Regan Steve Hudson MEMO
The Comptroller’s Office is one of more than 55 other state agencies that will participate in the Survey of Organizational Excellence this year. The Survey is a state employee satisfaction survey administered by the School of Social Work at the University of Texas. It is a tool used by the agency and state leadership to assess from the employees’ perspective the quality of life in the workplace. Results will be shared with agency management and employees and used to pinpoint areas where we are successful and identify areas where we need to make improvements. An independent contractor tabulates survey results and individual survey responses anonymous. The Survey of Organizational Excellence was distributed the week of November 29, 1999 and employees have approximately 14 days to complete the survey. Our goal for this survey is a 100 percent response rate. The more employees that complete the survey assures a more accurate picture of the agency’s strengths an areas needing improvement. Additional information about the survey is available on the Internet at: http://www.utexas.edu/depts/sswork/survey/ If you have general questions regarding the survey please contact LaDene Dorsett at 936-2831, Curt Besselman at 463-4792 or your survey liaison. Internet Web site The Survey Your Opinion Counts and Here’s Why
? Posters and Print Media Comptroller Rylander knows that asking questions is the best way to learn. That’s why we’re asking for your participation in the Survey of Organizational Excellence. The survey is administered by the University of Texas School of Social Work. Responses will remain anonymous and results will be shared with agency employees. Our goal for this survey is 100 percent employee response to accurately evaluate the agency’s strengths and areas for improvement. All employees are encouraged to participate. Your opinion counts! For more information, call LaDene Dorsett at 936-2831 or Curt Besselman At 463-4792.
Comptroller of Public Accounts Strategic Plan SURVEY OF ORGANIZATIONAL EXCELLENCE RESULTS During the month of December, the University of Texas at Austin’s Survey of Organizational Excellence was distributed to each Comptroller employee. The Survey is designed to assess employee satisfaction with their work environment and has been administered by the university’s Center for Social Work Research since 1980. Factors include general organization, team perceptions, physical work setting, personal demands, and communication. The Comptroller's office participated in the survey for the first time ever under Comptroller Carole Keeton Rylander and achieved 54% employee participation! Of the 17 large agencies that participated in the survey this year, the agency was second overall--and that group includes agencies that have participated many times before. The Survey is organized into 20 "constructs" or categories designed to broadly profile areas of the work environment. Employees were asked to rank answers on a scale from 1-5 with three being the average. In 17 of the 20 constructs, the agency ranked above average. The remaining 3 constructs indicate opportunities for growth. Two of the strengths were Strategic Orientation and External Communication; employees identified Fair Pay and Empowerment as areas of concern. In comparison to agencies of like size, scores for the Comptroller’s office ranked higher in each of the 20 constructs, with the exception of Fair Pay and Benefits. The Survey results will be shared with executive administration, agency managers and employees. Human Resources will meet with division managers to discuss their specific division results and distribute a comprehensive report of survey results. The agency anticipates forming manager and employee focus groups to address strategies to maintain the agency’s strengths and to improve areas identified as opportunities for growth. Managers and employees will be provided a full range of information enabling them to initiate programs and policies that will assist in a journey to excellence. Further information on the survey instrument may be obtained from the University of Texas at Austin Center for Social Work Research at http://www.survey.utexas.edu.
REPORTING RESULTS *AGENCY *MANAGEMENT *EMPLOYEES
Survey of Organizational Excellence Fall 1999 Survey Results Response Rate 54% Total Respondents 1406 Surveys Distributed 2620 Highlights of Survey of Organizational Excellence Results Total of 20 constructs designed to broadly profile areas of the work environment *Received scores of 3.0 or above in 17 constructs *Received scores below 3.0 in 3 constructs
Who Participated? Male 39.19% Female 43.67% Race/Ethnic Identification African-American 11.17% Hispanic-American 17.14% Anglo-American 47.65% Asian-American 2.13% Other 3.06%
Highest Scoring Constructs: Agency Strengths Strategic Orientation 397 Time & Stress Management 365 Quality 361 External Communication 361 Benefits 355 Lowest Scoring Constructs: Opportunities for Improvement Supervisor Effectiveness 285 Fair Pay 289 Empowerment 294 Fairness 305 Holographic (Consistency) 308
Highest Scoring Constructs: Agency Strengths Survey Construct CPA Avg. Statewide Avg. Point Difference Strategic Orientation 397 392 5 pts. Above Time & Stress Management 365 336 29 pts. Above Quality 361 360 1 pt. Above External Communication 361 362 1 pt. Above
Lowest Scoring Constructs: Areas of Concern Survey Construct CPA Avg. Statewide Avg. Point Difference Supervisor Effectiveness 285 293 8 pts. Below Fair Pay 289 302 13 pts. Below Empowerment 294 304 10 pts. Below Fairness 305 289 16 pts. Above Holographic (Consistency) 308 317 9 pts. Below
Comptroller of Public Accounts Survey Construct Scores There are two sets of questions in the survey. One set refers to the organization as a whole, and the other set refers to the employee’s immediate work group. Employees are asked to indicate how strongly they agree or disagree with a question that describes the organization. Possible responses to the questions include: (1) strongly disagree; (2) disagree; (3) feel neutral; (4) agree; (5) strongly agree; and, (6) don't know/not applicable. The rating scale is 1 to 5 with 5 being the most positive response. Organizational Code Survey Results Highest scoring constructs indicated in bold text. Lowest scoring constructs noted in italic text.
Survey Cheerleaders *Familiar, frequent interaction with employees *Liaison to disseminate information, address concerns *Recognition of Cheerleaders