Download
1 / 14
140 likes | 459 Views
We’re going to cover in this tutorial is what is a fishbone diagram. Components of a fishbone diagram, when to use fishbone diagram, and I also show you assure sigmaXL presentation. So first, what is a fishbone diagram?

E N D
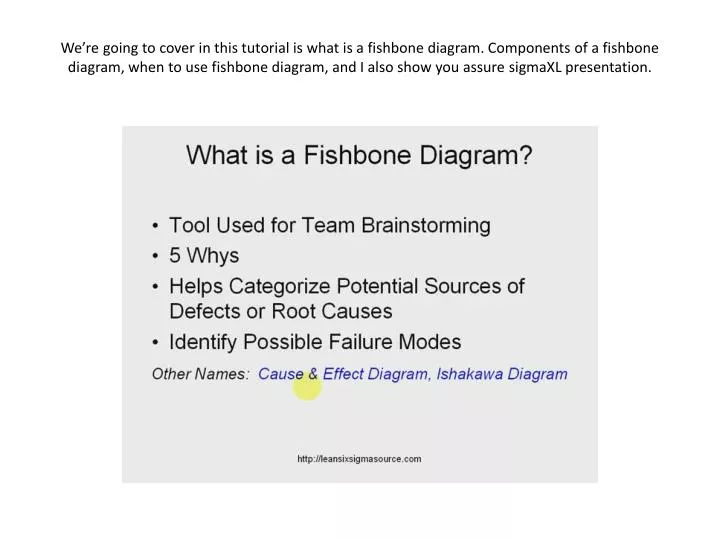
We’re going to cover in this tutorial is what is a fishbone diagram. Components of a fishbone diagram, when to use fishbone diagram, and I also show you assure sigmaXL presentation.
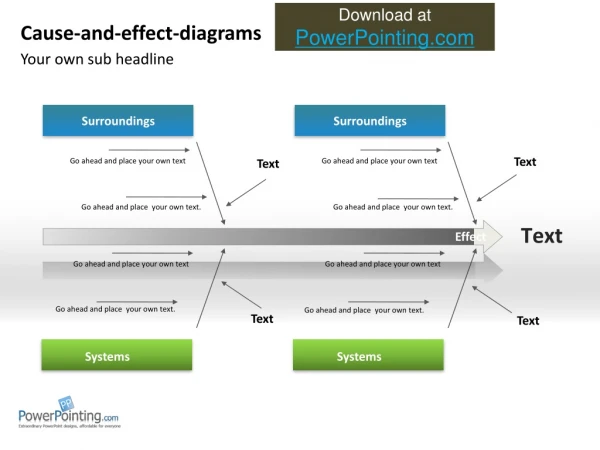
So first, what is a fishbone diagram? • Well, it is a tool used when you’re brainstorming with a group of people for your lean sigma projects. • And you are going to ask five whys and continuously ask questions of why to drill down to reveal your causes and all will be demonstrated in my presentation later. • It also helps to categorize potential sources of defects or root causes. And I can also help you to identify possible failure modes. • Other names of fishbone diagrams are “Cause and Effect Diagram” and “Ishakawa Diagram”. Ishakawa name is the doctor of Japanese engineer who popularize fishbone diagram.
The components of fishbone diagrams are • the head of the fish which is the effect or a outcome, horizontal branches which are the causes, • then have the sub-branches which represent the reasons, and then you are going to have branches of your fish broken up of usually non service process. • You are going to broke up with methods, materials, people, equipment, your measurement technique and environment. • Now for service processes, it can be helpful use 4 P’s which are policy, procedures, plant and people that help you separate those thing out.
So, when do you want to use fishbone diagram? There are two faces to use fishbone diagram. The analyze face when you go brainstorm wit possible root causes. And also the improve face when you create list of failure modes for your failure modes and effects analysis. So, when do you want to use fishbone diagram? There are two faces to use fishbone diagram. The analyze face when you go brainstorm wit possible root causes. And also the improve face when you create list of failure modes for your failure modes and effects analysis.
Okay, now you are going to see entire fishbone diagram. Your place is to write here project name, date, who did it and notes up here. You can see… You have people, material, environment, methods, machine equipment, measurement, and then head of the fish here is your problem or effect statement.
Okay, so let’s do an example. Let’s focus on… First you’re going to need to write your problem statement or effect. This example is going to be “Paint Defects”.
Let’s talk about some possible sources of paint defects. Let’s look at people form. Let’s say you are making brain storming and somebody says “lack of training”. The next thing you are going to do is asking why lack of training is. Say you don’t have defined procedures. It is hard to ask operators to check paint but they don’t know what they are checking for. So, there is no primer on what is suppose to be check. And you can keep drilling down.
Material... So, say you have like some middle castling on source and they sanded before painting it. Let’s say we have issues with sanding. Why is sending is an issue? It could be discs are too rough.
Environment… That example could be like; your paint boot is too humid. There are no climate controls. OK. So, want you get climate controls they decided to the side on. Figure out what they need to be! So, you can keep drilling down, keep drilling down, keep drilling down…
Let’s do another one in measurement. Let’s say you don’t wash your paint to be too wide or too fix. So, you have thickness mater. What’s wrong with the thickness meter? It could be out of calibration. So, you can see it so for that is what you do. Those are just a couple examples how you can use this tool. And go back brainstorming.
I am showing you on excel. You can use this on your projector. You can do this with group or you can use it with flipchart paper. It is really easy added on to it. I am going to show you that really quick.Drag this down. And pull the arrow up to…
What I do now is single click on + Ctrl single click on cause. Copy and paste… Okay so I am going to drag this down. Here, barabimbaraboom I have a cause and another sub-cause. So, it is very easy to expand. You can do this on flipchart paper and then copy this type of format so your presentation will be nice and neat. So all you need to do is just copy like an another image .
Today we covered what is a fishbone diagram, components of a fishbone diagram and branches horizontal branches, when to use fishbone diagram; you can analysis, you can improve faces.