Download
1 / 43
430 likes | 584 Views
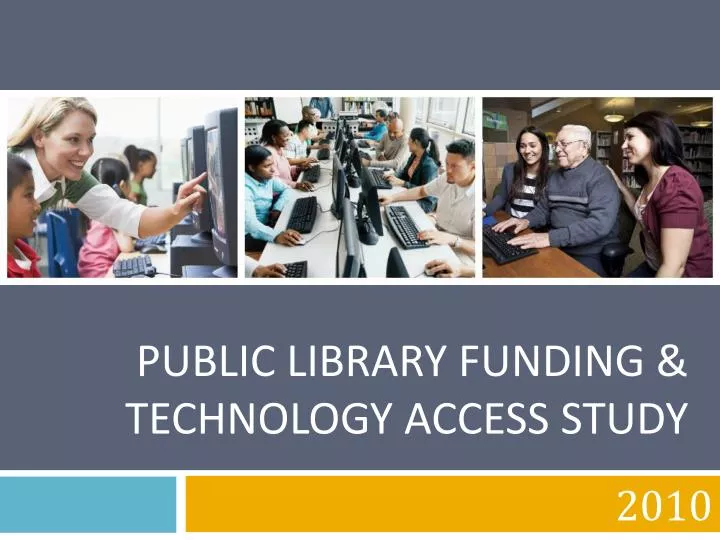
Public Library Funding & Technology Access Study. 2010. Presented by:. John Carlo Bertot, Ph.D . Professor and Director Center for Library & Information Innovation College of Information Studies University of Maryland jbertot@umd.edu. Denise M. Davis Director

E N D
Presented by: John Carlo Bertot, Ph.D. Professor and DirectorCenter for Library & Information Innovation College of Information StudiesUniversity of Maryland jbertot@umd.edu Denise M. Davis Director Office for Research & Statistics American Library Association dmdavis@ala.org Larra Clark Project Manager Office for Research & Statistics American Library Association lclark@ala.org
Webinar goals • Share high-level findings and trends from 2009-2010 report • Share new tools for using the data to support state and local planning and advocacy • Create forum for conversation around study findings and key issues related to the sustainability of public library technology
Study background • The Public Library Funding & Technology Access Study assesses public access to computers, the Internet and Internet-related services in U.S. public libraries, as well as the impact of library funding changes on connectivity, technology deployment and sustainability. • The project, building on work begun in 1994 by John Carlo Bertot and Charles R. McClure, is the largest and longest-running study of Internet connectivity in U.S. public libraries.
Study background • Three components to Study: • Data collected from public libraries of all sizes through national online survey – responses come from both the branch and the system level; • Interviews with library staff involved with the planning and deployment of public access computing and related services; site visits to a sample of libraries; and • An annual questionnaire to State Library Agencies on key technology and funding issues.
Key messages • Healthy public libraries play a vital role in ensuring digital opportunity for all. • Libraries bring together free access to computers and the Internet, robust electronic resources and expert assistance to help people succeed and thrive online. • At a time when many Americans are facing job losses, working to gain new skills and seeking assistance in an increasingly digital world, U.S. public libraries are first responders in a time of economic uncertainty.
Key messages • As government information and resources increasingly move online, public libraries are playing a greater role in helping people access and use e-government services. • Snowballing funding cuts at state and local levels are forcing thousands of libraries to literally lock away access to these resources as they reduce operating hours. • We respect the budget issues in state and local government, but this research demonstrates that libraries are an essential service throughout the country.
Finance Results Denise M. Davis Public Library Funding & Technology Access Study 2010
The differences are in the details Different from what IMLS and State Libraries collect annually from public libraries, PLFTAS collects finance data from the director of the public library, or designee, for the following: • Operating expenditures for the current fiscal year and anticipated expenditures (operating budget) for the upcoming fiscal year • Detailed by source of funding and category of expenditure • Salaries (incl. benefits), collections, other expenditures
Technology-related expenditures Detailed funding data • Salaries/Benefits for technology staff • Outside vendors • Hardware/Software • Telecommunications Revenue source categories reported include: • Local/county • State (including state aid to public libraries, or state-supported tax programs) • Federal • Fees/fines • Donations/local fundraising • Government grants (local, state or national level) • Private foundation grants
Estimated changes during a fiscal year and future fiscal year
State Libraries surveyed Qualitative data to support quantitative reporting • Georgia reported state funding reductions greater than 7 percent each year for the past three fiscal years. When we look at data reported by public libraries in Georgia we can interpret declines in reported funding from State sources and increases in other areas of funding to compensate for the corresponding decline. • Visit states to understand what is happening “on the ground”.
Why do we collect the detail we do? • To specifically understand public access computing trends • To understand support for technology – the financial kind – we must ask about sources of revenue to support public access computing • Together, these data provide early forecasting about public library funding and expenditures that ALA and others use to advocate for libraries.
How are data analyzed? • Total response (Figure 10) • Metropolitan status • Detail by pre-assigned metropolitan codes of rural, suburban, urban (Figure 12) • Population served ranges • Using the ALA Public Library Association population range divisions, the data are secondarily analyzed by those ranges to identify trends not observable by metropolitan status detail alone.
FY2010-2011 trends Finance data as indicators of change • Real-time finance data • Weighted to calculate national estimates • PLFTAS estimates have been confirmed in later IMLS annual public library reports • A 2006 ALA study revealed that libraries follow a set pattern of reducing expenditures when economies are down – they cut collection expenses first, then other expenses (like programming, repairs, equipment upgrades, OPAC upgrades, etc.), then reduce staff expenses last.
Regardless of metropolitan status, fewer libraries reported any increases in operating budgets in FY2010 from FY2009, and more libraries reported operating budget decreases.
Overall, technology-related expenditures have declined and this figure shows what libraries expect in the 2011 operating year. • Urban libraries report an anticipated decline in increased technology spending in 2011 – 5.3% reporting any increase, while 3.9% anticipate less drastic cuts (-3.9% anticipating decreases of more than 10%). The number of urban libraries anticipating level funding rose 8.5% from FY2010. • Suburban libraries report similar shifts, with 2.5% fewer reporting increases of 10% or more. • Rural libraries anticipate little change – already challenged financially.
The FY2009-FY2010 change in average technology-related expenditures for all library systems reporting are presented in this figure.
FY2009-FY2010 change in average technology-related expenditures In FY2009-2010 libraries tried to maintain funding for technology, while overall operating expenditures showed declines in other areas. • Note the proportional variation in reported expenditures for funding sources – state, federal, etc. • Note the decline in expenditures from local/county sources for hardware/software and telecommunications. Those expenditures were picked up in other revenue categories. • Also keep in mind the impact of a few urban or suburban libraries spending more and the impact on deriving national estimates.
Finance Indicators and Local Use • The finance data, with the source detail, expose patterns of reallocating expenditures to or away from tax sources (e.g., local, state, federal) to/away from soft funding sources (e.g., fees/fines, donations, grants, etc.). • The soft funding categories detailed in PLFTAS are aggregated to an “other” category in national data from IMLS. • Knowing the range of funding sources and the proportion of expenditures going to each helps libraries • Understand what similar libraries are spending. • Plan more effectively for maintaining or improving the infrastructure for public access computing services. • Advocate for stable funding of technology-related expenditures that support essential public access computing services.
Public Library Funding & Technology Access Study John Carlo Bertot Center for Library & Information Innovation College of Information Studies University of Maryland jbertot@umd.edu www.plinternetsurvey.org Selected Findings from the 2009-2010 National Survey
Why the Survey? • Longitudinal data collection since 1994 • Provides snapshot of • Library public access technology infrastructure • Capacity • Internet-enabled services • Challenges and issues • Funding
Why the Survey? • Informs policy makers of what libraries do in their communities in key areas of • Access to the Internet • Access to increasingly digital-only content and services • Employment • E-government • Databases • More • Digital literacy
Methodology • To generate both national and state data, the 2009-2010 survey used • Proportionate sample based on MSA and state with replacement • Weighted analysis • the 2007 IMLS public library dataset as the universe file • Received 7,391 responses for a 83.4% response rate
Community Access Points • 66.6 percent of library branches report that they are the only provider of free public computer and Internet access in their • Overall, public library branches report an average of 14.2 public access workstations, up from 11.0 in 2008-2009
Community Access Points • 82.2 percent of public library branches offer wireless Internet access, up from 76.4 percent reported in 2008-2009 • Libraries offer a range of technology and information literacy classes • Library usage is up across the board
Broadband • 14.8% libraries report public access connection speeds of less than 1.5mbps • 27.4% 1.5mbps • 33.4% 1.6mbps-10mbps • 18.4 greater than 10mbps • 53.0% of rural libraries report public access speeds of 1.5mbps or less • 77.2% of urban libraries and 55.4%of suburban libraries report public access speeds of greater than 1.5mbps
E-government • 88.8% help people understand and use government websites • 78.7% help people apply for E-government services • 66.3% help people complete E-government forms
Employment • 88.2% provide job databases and resources • 74.9% provide civil service examination materials • 68.9% offer software and resources for resume creation • 67.1% help people complete online applications
Key Issues and Challenges • Costs • Staff • Technology – upgrades, replacement, maintenance • Buildings • Space • Cabling/wiring • Staff • Number • Expertise • Increased usage • Library in general and • Public access technology in particular
Key Issues and Challenges • Adequacy of infrastructure
Key Issues and Challenges • Urban stress • More services and aggregate capacity, but… • More likely to report reduced hours (23.7% compared to 14.5% overall) • More likely to report inadequate • Broadband (52.2% inadequate connection some or all of the time as compared to 45.1% overall) • Workstations (39.6% consistently fewer workstations than necessary compared to 18.2% overall)
Trends and Implications • Investment in basic technology infrastructure (i.e., broadband, workstations, wi-fi) • But not library’s • Capacity • Staffing • Hours available • Building • Increasingly services are shifting to user devices such as smart phones • This will require additional development and investment
Some Concluding Comments • Increased usage does not translate into increased budget • Nice to have, not essential service • ARRA/Broadband - $7.2 Billion • NTIA/BTOP • RUS/BIP • FCC National Broadband Plan • IMLS and CBO principles/guidelines • Digital literacy • Significant opportunities, but some substantial challenges
Additional Resources • Issue briefs in key areas of: • Libraries and Broadband • Libraries and Community Access • Libraries and E-government • Libraries and Employment Available at www.plinternetsurvey.org More coming – state/national comparisons in areas of employment and E-government
Looking Ahead: Planning for rapidly changing content formats Unlike shelving that is purchased once and replaced infrequently, and which has a life of decades, technology-related infrastructure changes annually. • Technology-related infrastructure is at the core of how libraries operate. Without adequate and stable funding, this infrastructure will suffer. • Public access computing is far more visible than print resources. When there is a wait list for a book, library patrons are patient. When a resources is accessible only via a computer and that computer is down, or the hardware/software is inadequate to support access to valuable library resources, the patron sees that and is far less forgiving. • As libraries move ever more quickly to non-print resources, maintaining and improving the public access computing infrastructure is critical. Without adequate hardware, software, and Internet access speeds libraries will be unable to provide the services its community requires.
QUESTIONS? Public Library Funding & Technology Access Study 2010
Wrap up • Stay connected, join the conversation: • Follow ala_ors Twitter feed • Send us links to your Flckr photos • Check out new blog starting in September: ors.ala.org/libconnect • Participate in the 2010-2011 national public library survey starting September 7: www.plinternetsurvey.org • Find links to all study materials and related resources online at www.ala.org/plinternetfunding